The Problem Nobody Wants to Admit
Here is the ugly truth about most D2C inventory operations: your replenishment logic is built on averages.
Your purchasing team pulls a weekly Excel export from Shopify or NetSuite, calculates average daily sales across your entire catalog, and sets a blanket reorder point. Maybe they use a Google Sheet with a VLOOKUP that someone built in 2022 and nobody fully understands anymore.
The Result Nobody Tracks
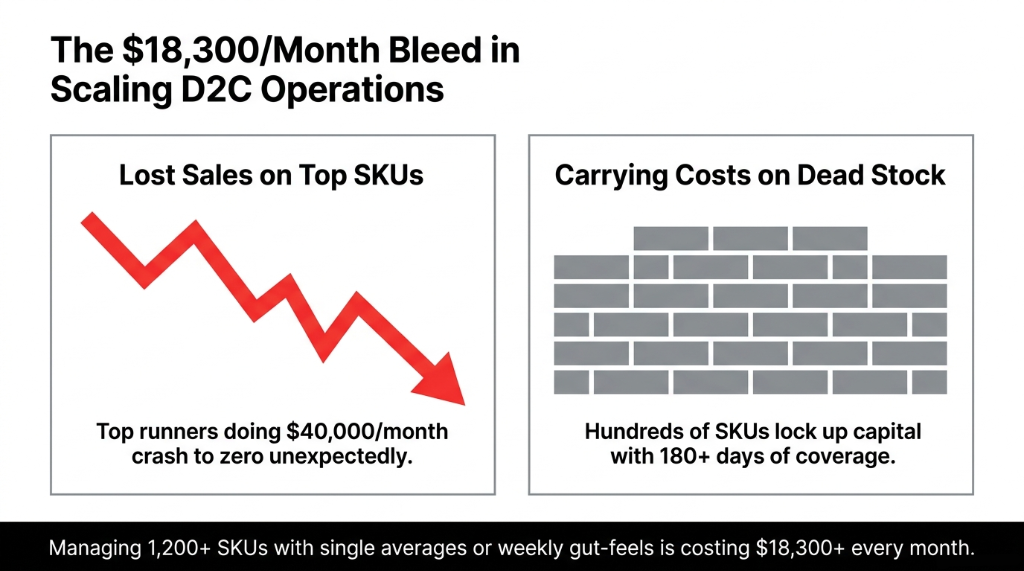
Your top 12 SKUs — the ones doing $40,000/month in revenue — run dry 3.7 times per quarter because their velocity is 6x the catalog average.
Meanwhile, 200 SKUs sit with 180+ days of coverage, locking up $94,000 in working capital that could be funding your next product launch.
We see this in 8 out of every 10 Odoo onboardings we do across the US, UK, and UAE. The brands are not incompetent — they simply never had SKU-level coverage visibility before.
Stock Coverage — The Core Formula
Coverage (Days) = On-Hand Quantity / Average Daily Demand
But when you run this across 1,200 SKUs simultaneously — segmented by warehouse, by product category, and filtered against open purchase orders — that is where Odoo starts doing things that Excel never could.
Why Odoo's SKU-Level Coverage Beats Every Spreadsheet You've Built
Most inventory tools give you a bird's-eye view. Odoo forces you to zoom in — to the individual SKU — and that granularity is what prevents stockouts on your $3,200/month runner while you are busy worrying about the SKU that sells 2 units a week.
Here is what Odoo's stock coverage analysis actually computes at the SKU level:
What Odoo Computes Per SKU
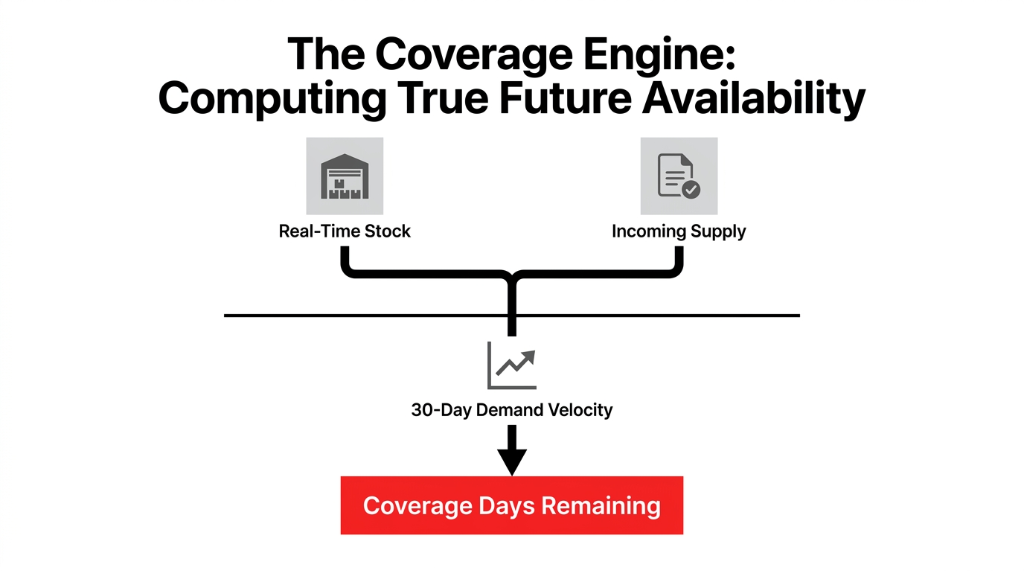
On-Hand Quantity
Across every warehouse and sub-location, updated in real time
Average Daily Demand
Calculated from sales order history over a configurable window (7, 30, or 90 days)
Incoming Supply
Open purchase orders and manufacturing orders pulled into the coverage equation
Coverage Days Remaining
The final number: "this SKU runs out in 6 days" or "this SKU has 310 days of stock"
Odoo surfaces this inside the Inventory → Products → Forecasted view and through the Replenishment Report, but the real power is in customizing those views to show coverage by SKU sorted ascending — so your most critical shortfalls are at the top of every morning's review.
Client Result: UK Apparel Brand (890 Active SKUs)
Before: Buyer spent 37 hours per week on manual reorder reviews.
After: 11 hours per week, with zero stockouts on their top 30 revenue-generating SKUs across an 18-week window post-go-live.
How to Set Up SKU-Level Coverage Analysis in Odoo (Step by Step)
This is the exact workflow we implement for every client. Not theory. What we actually do.
Step 1: Clean Your Demand History Window
Go to Inventory → Configuration → Warehouses and set your replenishment lead times per vendor. This affects how Odoo projects forward demand. If you use a 7-day average for a product that sells seasonally, you will get garbage coverage numbers. We recommend a 30-day rolling window for steady-state SKUs and a 90-day window for anything seasonal.
Step 2: Activate the Replenishment Report
In Odoo 16 and 17, navigate to Inventory → Operations → Replenishment. Sort the view by "Days of Stock" ascending. This immediately shows you every SKU with fewer than 14 days of coverage — which is your action list for today, not next Monday.
Step 3: Configure Reorder Rules by SKU
For each SKU, set the Minimum Quantity (reorder point trigger level in units), the Maximum Quantity (ceiling to prevent over-purchasing), and the Multiple Quantity (vendor pack sizes). If your vendor ships in packs of 12 and you order 10, that is $200 in unnecessary friction per PO.
Odoo supports both fixed reorder rules and make-to-order logic. For SKUs above $500 unit cost, we always recommend make-to-order to avoid carrying cost risk.
Step 4: Build a Custom SKU Coverage Dashboard
Using Odoo Studio (available on Enterprise) or a custom module, build a grouped view that shows SKU name and internal reference, current on-hand quantity, average daily demand (30-day), coverage days (calculated field), open PO quantity inbound, and adjusted coverage days (on-hand + inbound divided by average daily demand).
The Time Savings Are Real
This single view saves the average inventory manager 4.3 hours per day in cross-referencing between Odoo, Shopify, and whatever spreadsheet they are currently maintaining in parallel.
Step 5: Set Coverage Thresholds and Alerts
Use Odoo's Activity system or a custom automated action to trigger alerts when any SKU drops below your critical coverage threshold. We set these thresholds for every client:
| Alert Level | Coverage Days | Action |
|---|---|---|
| Red Alert | < 7 days | Emergency reorder |
| Yellow Alert | 7 - 14 days | Standard reorder queue |
| Green Zone | 15 - 60 days | Healthy — no action |
| Overstock Flag | > 90 days | Review for markdown or redistribution |
The SKU Segmentation Nobody Talks About
Here is an insider move that most Odoo consultants skip: not all SKUs should be managed with the same coverage target.
We segment every client's SKU catalog into three buckets based on ABC analysis:
| SKU Tier | Revenue Share | Target Coverage | Review Frequency |
|---|---|---|---|
| A-SKUs (top 20%) | 73-78% of total revenue | 14-21 days | Daily |
| B-SKUs (middle 30%) | 17-22% of total revenue | 21-45 days | Weekly |
| C-SKUs (bottom 50%) | 3-7% of total revenue | 45-90 days | Monthly |
In Odoo, you apply this segmentation by tagging products in the product form with ABC categories, then filtering your replenishment report by tag. Your buyer now opens Odoo every morning and sees only A-SKUs in the critical view — the 240 SKUs that generate $6.2M of your $8M ARR.
Client Result: US Pet Supplies Brand
This single segmentation change meant their purchasing team stopped reactively ordering C-SKUs on gut feel and started proactively securing A-SKUs 21 days in advance.
Stockout incidents dropped 67% in 90 days. Not because they bought more — because they bought smarter.
The Overstock Problem Is Equally Expensive
Everyone obsesses over stockouts. Frankly, overstock kills cash flow just as fast — and quietly.
Carrying cost for excess inventory runs between 18% and 32% of inventory value per year across warehousing, insurance, and capital opportunity cost *(Harvard Business Review, 2023 supply chain benchmarks)*. If you are sitting on $400,000 in inventory with 190 SKUs above 90-day coverage, your annual carrying cost on that excess alone is between $72,000 and $128,000.
Real Example: Singapore Electronics Distributor
We ran this filter 11 days after their Odoo go-live. Their top overstock SKU had 314 days of coverage on $67,000 worth of product. Nobody had looked at it in 4 months because it "was not causing problems."
That $67,000 in dead inventory was funded by a revolving credit line at 9.2% annual interest — costing them $513 a month in interest charges alone on a product gathering dust.
That is the kind of thing that only becomes visible when you stop looking at inventory as a whole and start looking at it SKU by SKU.
What Braincuber's Odoo Implementation Actually Does Differently
We do not just install Odoo and hand you the manual. In 150+ implementations across the US, UK, UAE, and Singapore, we have built a coverage analysis framework that goes beyond out-of-the-box functionality.
Specifically, We Deliver
- ▸ Custom SKU Coverage Dashboard built in Odoo Studio — one screen, all the data your buyer needs, zero tab-switching
- ▸ Automated Replenishment Triggers with vendor-specific lead time buffers baked in — so your 21-day lead-time China supplier gets an automatic 7-day safety buffer on every reorder rule
- ▸ ABC Segmentation Tagging applied to your full product catalog on day one, not after 6 months of "going live and figuring it out"
- ▸ Overstock Alert Automation that fires a task to the purchasing manager when any SKU crosses 90 days of coverage — before the finance team notices it on the balance sheet
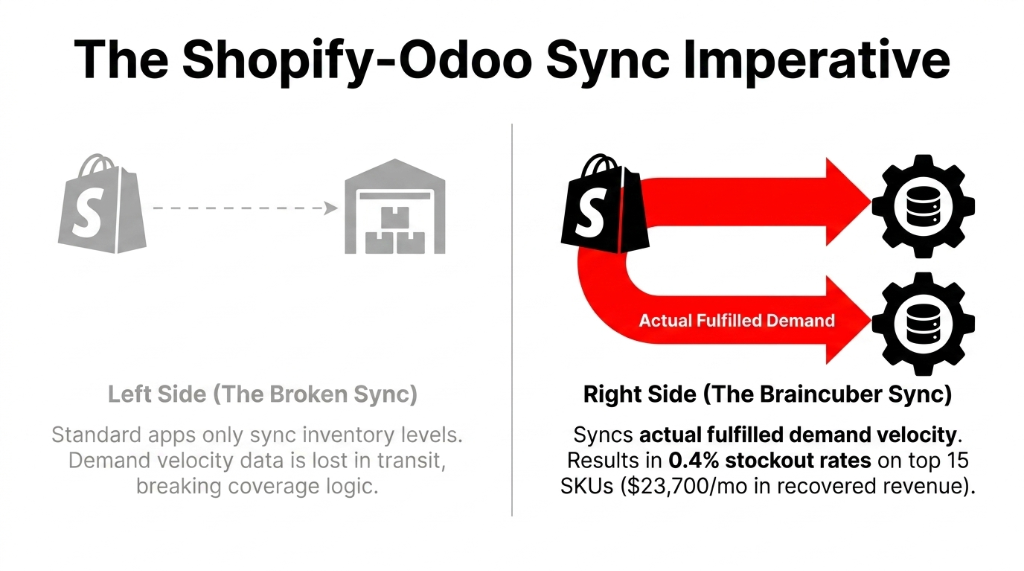
- ▸ Shopify-Odoo Sync for brands selling D2C, so sales velocity data feeding the coverage calculation reflects actual fulfilled orders, not just sales orders that might still be processing
(Yes, we know your current Shopify app syncs inventory. It does not sync demand velocity back to Odoo's replenishment logic. That gap is why your coverage numbers are always slightly wrong.)
Client Result: US D2C Health Supplement Brand
Went from a 3.1% monthly stockout rate on their top 15 SKUs to 0.4% in 60 days after this setup.
That translated to $23,700/month in recovered revenue that was previously lost to "out of stock" on their Shopify storefront.
The Implementation Reality
We know what you are thinking: "How long does this actually take?"
For a brand with 200-800 SKUs and a live Shopify store, here is the real timeline:
28 Days to Full SKU-Level Coverage
Week 1
Data migration, product catalog cleanup, warehouse configuration
Week 2
Reorder rules setup, ABC tagging, coverage dashboard build
Week 3
Team training — your buyer learns the daily workflow in 3 hours
Week 4
Go-live with shadow monitoring — old system runs in parallel for 7 days
Not 6 months. Not a $500k NetSuite implementation. 28 days. That is what happens when your Odoo implementation partner actually knows your vertical.
FAQs: Odoo Stock Coverage Analysis by SKU
How does Odoo calculate stock coverage days for each SKU?
Odoo divides the current on-hand quantity by the average daily demand computed from a configurable historical window (typically 30 days). It also factors in incoming supply from open purchase orders, giving you an adjusted coverage figure that reflects real future availability, not just what is sitting in the warehouse today.
Can Odoo handle stock coverage analysis across multiple warehouses by SKU?
Yes. Odoo's multi-warehouse setup lets you view coverage at the SKU level per warehouse or consolidated across all locations. You can configure separate reorder rules per warehouse per SKU, so your Dubai warehouse and your London warehouse can have different coverage targets for the same product based on local demand velocity.
What is the difference between reorder point and stock coverage in Odoo?
A reorder point is a static quantity trigger — reorder when stock hits 50 units. Stock coverage is a dynamic days-based metric — this SKU runs out in 6 days at current sales velocity. Coverage analysis is more accurate because it adjusts automatically as demand changes, while a static reorder point set in January may be dangerously wrong by November.
How do I identify overstock SKUs using Odoo coverage analysis?
Filter your Odoo Replenishment Report to show SKUs with greater than 90 days of coverage, then sort by on-hand value descending. The top results are your working capital traps. Run this filter weekly and assign a review task to your purchasing manager to assess markdown, transfer, or return-to-vendor options for the top 10 items.
Does Odoo stock coverage analysis work for brands with seasonal demand spikes?
It works, but you must adjust your demand history window seasonally. Using a 30-day average during your off-peak period to plan for peak season will under-predict demand and trigger stockouts. We recommend switching to a 90-day average in the 60 days leading into peak season, or using Odoo's forecasting module with historical seasonality inputs for A-SKUs specifically.