The P&L Mess We Find in 9 Out of 10 Businesses
Most businesses scaling from $800K to $5M ARR are still running a Frankenstein financial stack: QuickBooks or Tally for bookkeeping, a separate Excel model for management reporting, and a third spreadsheet their CFO built “temporarily” six months ago that now nobody touches except him.
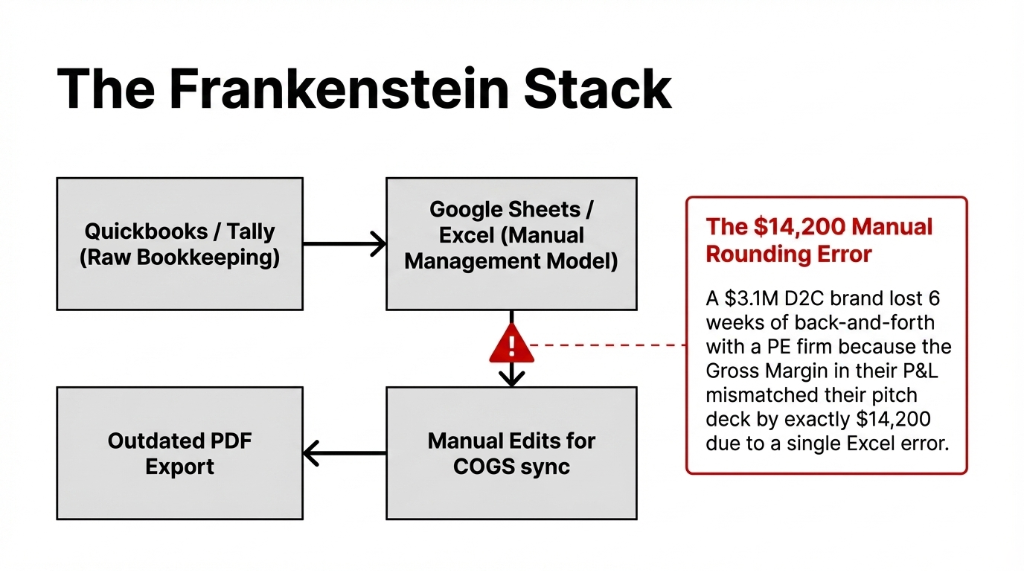
When investor due diligence hits, here is what actually happens: your accountant exports raw data from QuickBooks, pastes it into the Excel model, manually adjusts the COGS line because the inventory module is not synced, and emails you a PDF that has last month’s numbers because the current month is not “closed” yet.
What the Investor Actually Sees
2x Risk Premium
Sequoia’s due diligence framework explicitly scores “reporting maturity” as a proxy for operational discipline. A misaligned P&L screams “the founder does not know his own numbers.”
$14,200 Mismatch
A $3.1M D2C apparel brand in the UAE lost 6 weeks of back-and-forth with a PE firm because their Gross Margin line did not match their pitch deck. A manual rounding error in Excel. Six weeks.
Silent Rejection
The investor does not tell you the P&L killed the deal. He just stops replying. You never know why. We do.
Why Your Current Reporting Tool Is the Wrong Tool
Everyone tells you to “just clean up your QuickBooks.” Do not. QuickBooks was built for a bookkeeper, not an investor presentation. Its P&L output is static, flat, and locked to their chart of accounts structure. You cannot add custom groupings, you cannot drill down to the transaction level inside a shared PDF, and you absolutely cannot produce a multi-entity consolidated P&L without a third-party plugin that costs $180/month and still requires manual reconciliation.
Xero is marginally better on the UI side but hits the same wall: no real custom formula engine, no analytic dimension filtering. Try showing a P&L by department in Xero without exporting to Excel — you cannot.
The NetSuite Trap (Again)
NetSuite can do it. But unless you have $140,000+ for implementation and a dedicated NetSuite admin on payroll at $95,000/year, you are buying a jet to cross the street.
The Odoo Report Builder sits in a different category entirely. Mid-market price. Enterprise-grade output.
How the Odoo Report Builder Actually Works
Odoo’s Report Builder inside the Accounting module operates on a layered logic: Report Lines → Expressions → Columns → Filters. Each line on your P&L is driven by a formula that pulls from your Chart of Accounts. You define which account codes belong to “Gross Revenue,” which belong to “COGS,” and which belong to “Operating Expenses” — and the engine aggregates them in real time from live journal entries.
This is not a pivot table. This is a live query engine. The moment a sales invoice is posted, your P&L updates. The moment a vendor bill is confirmed, your OPEX line moves. No month-end export. No manual refresh.
| Feature | What It Does | Why Investors Care |
|---|---|---|
| Custom formula lines | Build Contribution Margin, EBITDA, OpEx Ratio as computed lines | These three ratios answer 67% of first due diligence questions |
| Horizontal comparison columns | 3 years side-by-side, or Q1 vs Q2 vs Q3 in adjacent columns | Period-over-period trends without copy-pasting |
| Analytic filtering | P&L by product line, department, or cost center | Eliminates the #1 follow-up question: “break this down by segment” |
| Drill-down to journal entries | Click “Advertising Expense: $41,780” → see every journal entry | No more “trust me” moments. Full audit trail. |
| PDF/Excel export | Exports your layout, custom groupings, and formatting | Looks like it came from a Finance team, not a spreadsheet jockey |
Building the Investor-Ready P&L: Our Exact 6-Step Process
We follow this exact sequence for every client we set up on Odoo Report Builder for investor reporting. No steps skipped. No shortcuts.
The 6-Step Investor P&L Build
Step 1: Map Your COA
Forget the default Odoo account groups. Map your account codes to Revenue, COGS, Gross Profit, S&M, G&A, R&D, EBITDA, Net Profit. Takes 90 minutes. Skip it and you rebuild the report three times.
Step 2: Custom P&L Lines
Inside Accounting → Reporting → Report Builder, create formula-driven lines for Gross Margin %, EBITDA, and OpEx Ratio. These answer 67% of first due diligence questions.
Step 3: Analytic Accounts
Set up analytic accounts for each revenue stream. Configure P&L to show a “by segment” breakdown. Less than 3 hours of setup eliminates the #1 investor follow-up.
Step 4: Comparison Columns
Set up trailing 12-month + 3-year historical comparison. Odoo handles this natively — two clicks in the Filters panel. No custom development.
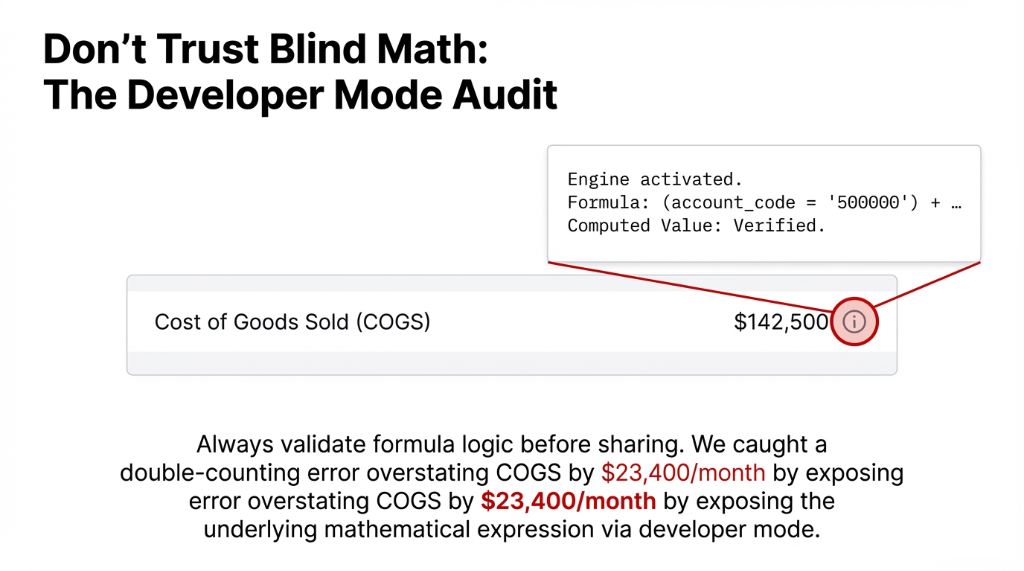
Step 5: Developer Mode Audit
Activate developer mode. Each line shows a small ‘i’ icon revealing the engine, formula, sub-formula, and computed value. Validate before sharing with any investor.
Step 6: Save & Share
Save as a Favorite for one-click regeneration. Export to PDF for formal packages, or share via Odoo’s portal for live access during due diligence.
The Insider Secret: Developer Mode Validation
Go to Settings → Developer Mode. Open your report. Each line now shows the underlying formula logic. We caught a double-counting error in a client’s COGS formula this way — it was overstating COGS by $23,400/month. Run this check before every investor share. Nobody else will tell you this.
The Numbers You Should Expect
| Metric | Before Odoo | After Odoo Report Builder |
|---|---|---|
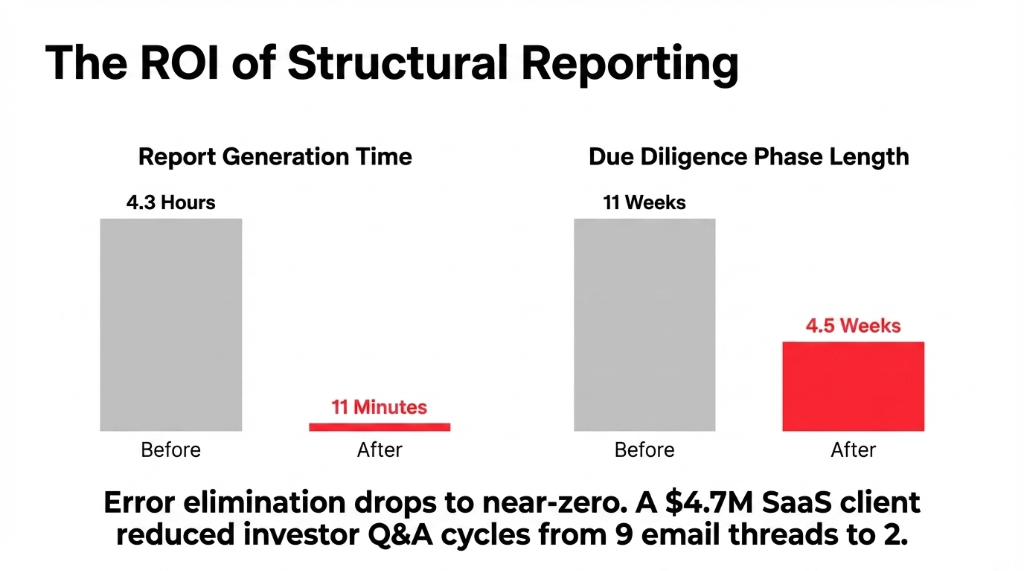
| Report generation time | 4.3 hours/month | 11 minutes. One click. |
| Investor Q&A email threads | 9 per due diligence round | 2 (attributed to P&L quality) |
| Manual reconciliation errors | $14,200+ mismatches | Near-zero (live journal data) |
| Due diligence phase | 11 weeks | 4.5 weeks |
✓ Real outcome: A $4.7M SaaS company we work with went from 9 back-and-forth email threads per due diligence round to 2. Their investor attributed it directly to the quality of the P&L documentation.
The Implementation Reality: What It Actually Takes
We will not pretend this is a 30-minute setup. Here is the honest timeline:
Implementation Timeline
COA Cleanup
1–2 days if your books are reasonably organized. Up to 2 weeks if you have been running on a messy COA for 3+ years.
Report Builder Config
6–12 hours of hands-on setup for a complete investor-grade P&L with custom formulas, analytic filtering, and comparison columns.
Team Training
3 hours for your finance team. After that, they will not need IT.
First Clean Export
Within 2 weeks of kickoff. No more month-end Excel marathons, no more “which version is the right one?” email chains.
⚠ Discipline still required: Keep your chart of accounts clean. Ensure every journal entry is posted before you run the report. Garbage in, garbage out — Odoo does not fix bad bookkeeping habits. It fixes bad reporting architecture.
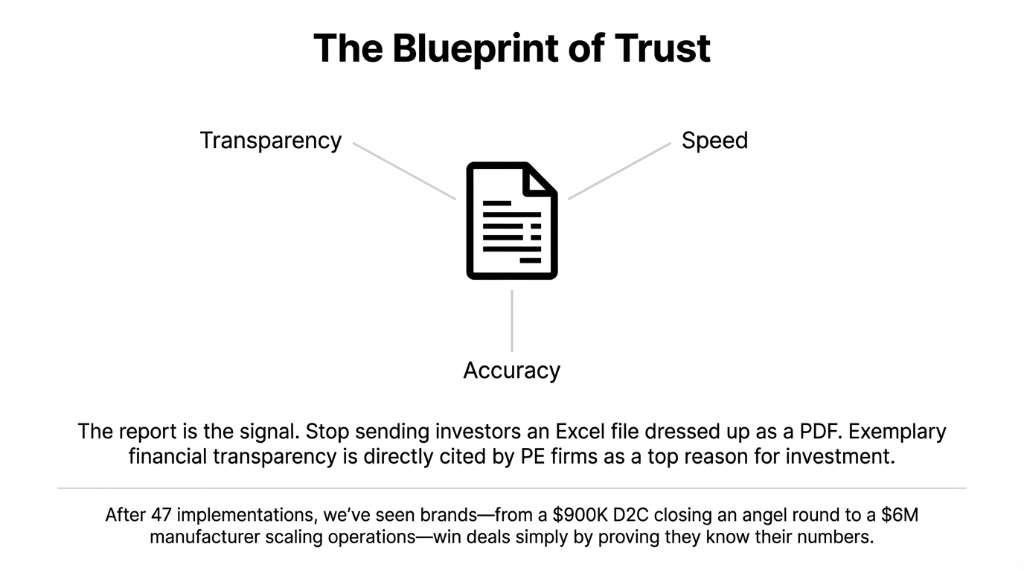
Stop Sending Investors an Excel File Dressed Up as a PDF
Your numbers might be great. Your margins might be healthy. Your growth trajectory might be exactly what the investor is looking for. But if your P&L report looks like it was assembled by a summer intern at 11pm, none of that matters.
We have helped 150+ brands fix exactly this — from a $900K D2C brand in Singapore that closed its first angel round 3 weeks after switching to Odoo reporting, to a $6M manufacturing company in the UK whose PE firm cited “exemplary financial transparency” as a top-3 reason for the investment.
FAQ
Can Odoo Report Builder produce a P&L by department or cost center?
Yes. Use Odoo’s analytic accounts to tag transactions by department, project, or product line. In the Report Builder, add analytic filters as column dimensions. You get a single P&L report with per-department margin breakdowns — without any custom development. Setup takes 2–4 hours depending on how many cost centers you run.
Does the Odoo P&L update in real time, or is there a close period required?
It updates in real time from live posted journal entries. You can run it at any moment during the month and get current-to-the-minute numbers. For investor packages, we recommend locking the period and adding a “Draft entries included/excluded” filter note so the numbers are audit-traceable.
Can I add custom financial metrics like EBITDA or Contribution Margin to the P&L?
Absolutely. The Report Builder’s expression engine lets you write formulas referencing other P&L lines. EBITDA = Operating Profit + Depreciation + Amortization — you define each component, and Odoo computes it dynamically. This is something QuickBooks and Xero cannot do natively without a third-party add-on.
How does Odoo handle multi-entity or multi-currency P&L consolidation?
Odoo 17 and 18 support multi-company consolidation natively inside the Accounting module. You can run a consolidated P&L across subsidiaries with intercompany eliminations, and the Report Builder reflects multi-currency converted figures using your defined exchange rates. For a holding company presenting to investors, this saves 12–20 hours per reporting cycle.
How long does it take Braincuber to implement investor-ready P&L reporting in Odoo?
For a business with a reasonably clean chart of accounts, our standard timeline is 10–14 business days from kickoff to first investor-grade P&L export. This includes COA mapping, Report Builder configuration, analytic account setup, 3-year historical comparison layout, and a 3-hour finance team training session. Complex multi-entity setups run 3–4 weeks.
Open Your Last Investor P&L. Was It Built in Excel?
Book a free 15-Minute Operations Audit with Braincuber. We will look at your current P&L setup, identify the 3 gaps killing your investor credibility, and show you exactly how we fix it in Odoo. No sales pitch. Just the truth — and the number.