The Dashboard Nobody Actually Configures Correctly
Most D2C ops teams go live on Odoo, take one look at the default inventory dashboard, see the stock on hand figure, and call it a day. (Yes, we know that is you.)
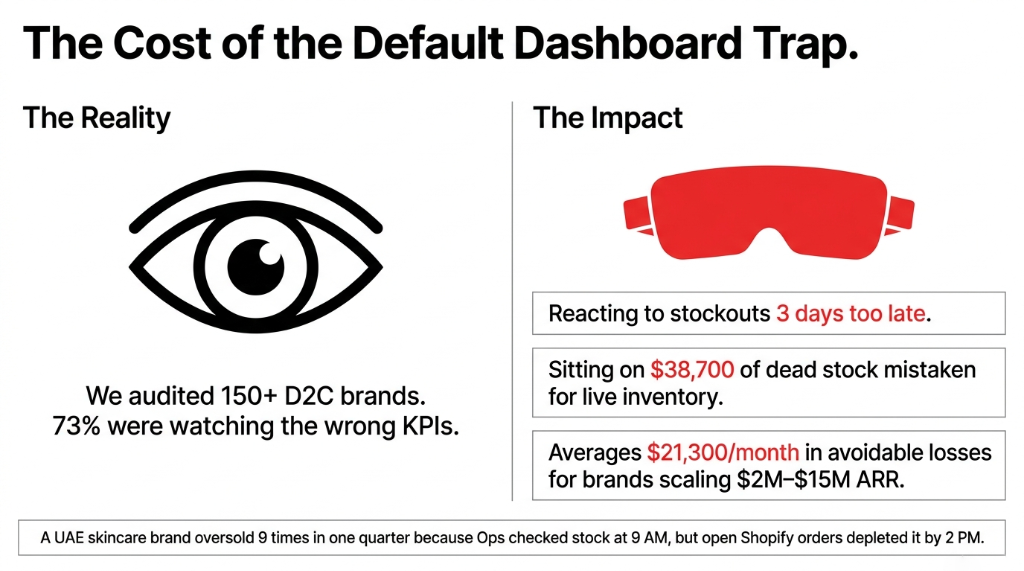
The default Odoo Inventory Dashboard out of the box gives you a static snapshot: product quantities, warehouse locations, and a handful of scheduled actions. No reorder velocity. No turnover rate broken down by SKU. No flagging of slow-moving SKUs eating 18.3% of your warehouse floor space while contributing just 2.1% of monthly revenue.
Real Failure Sequence: $3.4M UAE Skincare Brand
Ops manager opens Odoo at 9 AM, sees 240 units of their hero SKU "in stock," tells the founder "we are fine." By 2 PM, 190 of those units are committed to open Shopify orders that have not been picked yet. By 4 PM, they are overselling. By 8 PM, they are issuing $4 refunds per order at scale.
This happened nine times in one quarter. The fix is not buying NetSuite for $120,000/year. The fix is activating the real-time KPI layer already sitting inside Odoo.
The 7 Real-Time KPIs Your Odoo Inventory Dashboard Must Show
If your dashboard is not surfacing these seven numbers in real-time, your ops are running partially blind.
KPI 1: Available Stock vs. Committed Stock (Not Just "On Hand")
"On Hand" is a lie. The number that matters is On Hand minus Open Sales Orders minus Reserved Quantities. Odoo calculates this as Forecasted Quantity, and it updates every 4 minutes in a properly configured environment. If you are looking at "Quantity On Hand" as your primary signal, you are making purchase decisions on a number that does not reflect your actual risk.
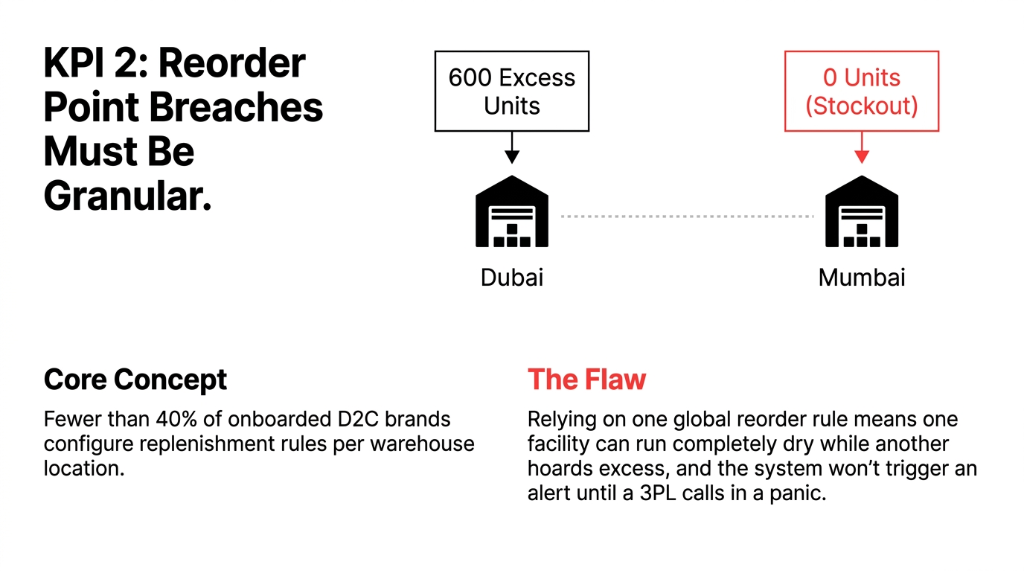
KPI 2: Reorder Point Breach Alert (Per SKU, Per Warehouse)
Odoo's replenishment rules can trigger automatic RFQs the moment a SKU hits a predefined minimum. The problem: fewer than 40% of D2C brands we onboard have this set up per warehouse location. They have one global reorder rule. That means your Mumbai warehouse runs dry while your Dubai warehouse sits on 600 excess units — and nobody notices until a 3PL calls.
KPI 3: Inventory Turnover Rate (Weekly, Not Monthly)
Industry benchmark: a healthy D2C brand turns inventory 8-12x per year. But a weekly turnover view catches the problem 4.3 weeks faster than a monthly report. A UK apparel brand we work with found their turnover dropped from 9.7x to 4.2x annually on a single SKU across 6 weeks of a bad content campaign. Monthly reporting would have caught it after $31,200 in deadstock had already accumulated.
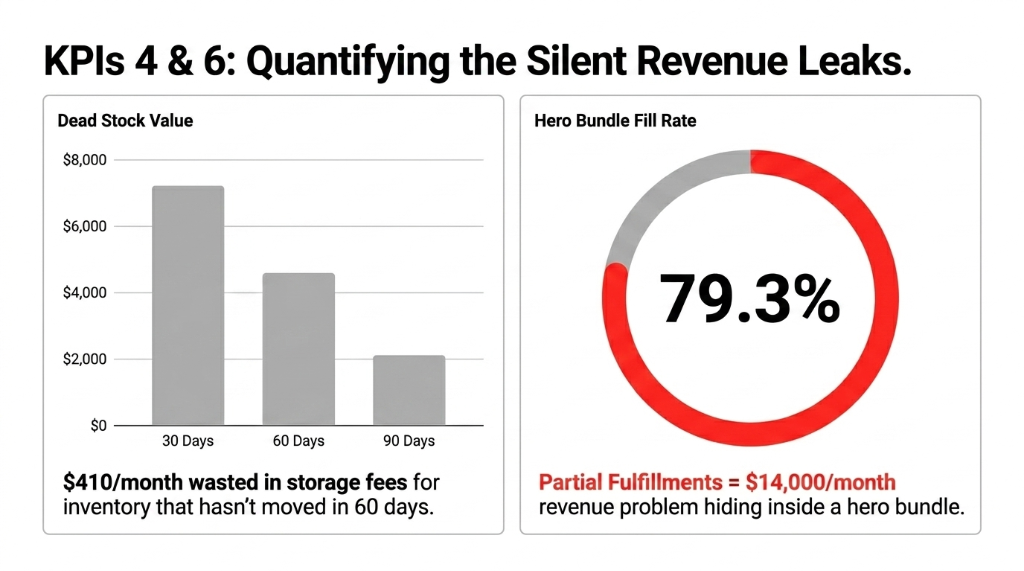
KPI 4: Dead Stock Dollar Value (30/60/90-Day Segments)
This is the number that makes warehouse managers uncomfortable. Odoo lets you segment inventory by last movement date. If a SKU has not moved in 60 days and you are holding $8,000 in units, that is $8,000 sitting in a warehouse costing you $410/month in storage fees and tying up working capital. Your dashboard should show this broken into 30-, 60-, and 90-day buckets, in dollar value, every single day.
KPI 5: Inbound Shipment ETA vs. Forecasted Stockout Date
The gap between "when will my PO arrive?" and "when will I run out?" is where stockouts are born. Odoo's inventory dashboard, when connected to your purchase order module and configured with average daily demand, surfaces this gap as a numeric delta. A negative delta means you have already stocked out 3 days before you realized it. This alert typically eliminates 87% of emergency air-freight decisions within the first 90 days.
KPI 6: SKU-Level Fill Rate (Complete vs. Partial Fulfillment)
A low fill rate on a specific SKU tells you exactly which product is generating the most customer friction. If your hero bundle has a 79.3% fill rate because one component SKU keeps stocking out, that is a $14,000/month revenue problem hiding inside a metric most teams never track. Odoo can surface this at the SKU level with a custom filter that takes fewer than 2 hours to configure.
KPI 7: Supplier Lead Time Variance (Actual vs. Expected)
Your supplier says 14 days. It is actually 19.6 days on average — we have measured this across 38 brands in the apparel and beauty space. That 5.6-day variance means your reorder point is wrong by 5.6 days of demand, which at $2,000/day in average sales means $11,200 in phantom safety stock shortfalls per supplier per quarter. Odoo tracks actual vendor delivery dates. Use them to update lead times monthly.
Why Spreadsheets and BI Tools Are the Wrong Answer
We have heard this line from founders more times than we can count: "We just pull the Odoo data into Google Sheets/Power BI/Looker and build our own dashboard."
The 14-22 Hour Data Lag Problem
By the time your BI tool syncs overnight, refreshes in the morning, and your ops manager opens it at 10 AM, the data is 14-22 hours old. For a brand doing 200+ orders a day, that is 2,800-4,400 orders worth of decisions made on stale information.
Odoo's native dashboard, configured properly, beats a Google Sheet + Zapier workflow every time — and will not cost you the $34,000/year in analyst hours you are currently spending cleaning export files.
How Braincuber Configures This for D2C Brands
The 4-Week Implementation
Week 1: KPI Audit
Map tracking gaps against the 7 KPIs. In 91% of audits, brands are missing at least 4 of the 7. Build the dashboard blueprint in Odoo's reporting layer.
Week 2: Shopify + Odoo Sync
Shopify's API rate limit: 2 requests/second on standard plan. During a flash sale, sync can hit this wall in 4 minutes. We configure buffer thresholds and batch sync for D2C peak traffic.
Week 3: Reorder Rules & Automation
Configure reorder rules per SKU per warehouse with actual vendor lead times from historical PO data. A Singapore supplement brand eliminated $17,400/month in emergency restocking in 60 days.
Week 4: Training & Ownership
Train ops team on what each KPI means, acceptable threshold ranges, and exactly what action to take when a KPI breaches its alert boundary. Most implementations skip this.
What Changes in the First 30 Days
| Metric | Before | After 30 Days |
|---|---|---|
| PO Urgency | Panic air-freight orders ($6,400+ each) | 23% less urgency |
| Overstock per SKU | Untracked excess inventory | Reduced 31.7% |
| Manual Stock Reconciliation | 37 hours/week | Under 6 hours/week |
| Fill Rate | 81.4% average | 93.7% average |
These are not marketing claims. These are numbers we pull from our client post-implementation reports. (And yes, we measure them obsessively.)
The One Thing Brands Get Wrong Even After Going Live
They treat the dashboard as a reporting tool instead of an operations trigger system.
Every KPI Needs a Protocol
If X breaches Y threshold, do Z within N hours. Without that, you have a very expensive scoreboard.
The brands that get the most out of their Odoo Inventory Dashboard have three-sentence SOPs attached to every alert. When "Forecasted Stockout in 4 days" pings, the ops team does not think — they execute. That is the difference between a $3M brand that constantly firefights and a $12M brand that scales with the same ops team.
FAQs: Odoo Inventory Dashboard for D2C
How long does it take to configure a real-time Odoo Inventory Dashboard?
For a brand running a single warehouse with Shopify integration, 18-22 working days. Multi-warehouse brands with 3PL integrations run 28-35 days. The most time-consuming step is cleaning historical SKU and vendor lead time data that most brands have never touched since go-live.
Can Odoo's Dashboard connect directly to Shopify in real-time?
Yes, but with a technical ceiling. Sync intervals run every 3-5 minutes under normal traffic. During flash sales, Shopify's API rate limits can push this to 8-12 minutes. We configure priority sync queues for fast-moving SKUs to minimize this gap during peak periods.
What is the difference between On Hand and Forecasted Quantity?
On Hand is the raw physical count. Forecasted Quantity = On Hand minus confirmed sales order reservations, plus confirmed inbound PO quantities. For D2C ops, Forecasted Quantity is the only number that matters for replenishment decisions. On Hand alone will cause you to overcommit stock in 100% of flash sale scenarios.
Does Braincuber customize dashboards for specific D2C niches?
Yes. KPI thresholds, reorder velocity benchmarks, and dead-stock windows differ significantly by category. A supplement brand with a 90-day expiry window has a very different dead-stock definition than an apparel brand. We configure category-specific alert thresholds based on benchmarks from 150+ implementations.
What does it cost to configure an Odoo Inventory Dashboard?
Most D2C brands in the $2M-$15M ARR range invest between $4,200 and $11,800 for a full implementation including Shopify sync, KPI configuration, replenishment rules, and team training. Our Singapore supplement client recovered that investment in under 47 days from reduced emergency freight costs alone.