The Lie Your Current P&L Is Telling You
Your QuickBooks or Xero shows total revenue, total COGS, and a gross margin percentage that looks healthy — maybe 38%. But that blended number hides the fact that your Amazon channel, after accounting for FBA fees ($3.22/unit average), referral fees (15% on most categories), return processing ($4.80 average per return), and inbound shipping costs to FBA warehouses, is actually running at 11.4% gross margin per unit.
Meanwhile, your Shopify DTC channel — same SKU, same product — is running at 52.7% gross margin because you ship direct from your 3PL at $6.40/unit and your return rate is 3.1% versus Amazon’s 11.8%.
You are looking at one number — 38% blended — and making inventory, marketing, and pricing decisions based on a fiction.
The Austin Skincare Wake-Up Call
Real client story: A skincare brand in Austin, Texas pulling $2.3M annually across four channels. Their CFO was convinced their hero SKU (a $48 vitamin C serum) was their best performer. It was — on Shopify.
On Amazon, after all channel costs were factored in, they were netting $2.11 per unit. Shipping 800 units/month on Amazon, investing $14,400/month in Amazon PPC, walking away with $1,688 in actual profit from that channel.
(Yes, the CFO’s face when we showed him the channel-level breakdown was something we will never forget.)
Why Your “Good Enough” Reporting Setup Is Going to Kill Your Margins
Stop us if this sounds familiar.
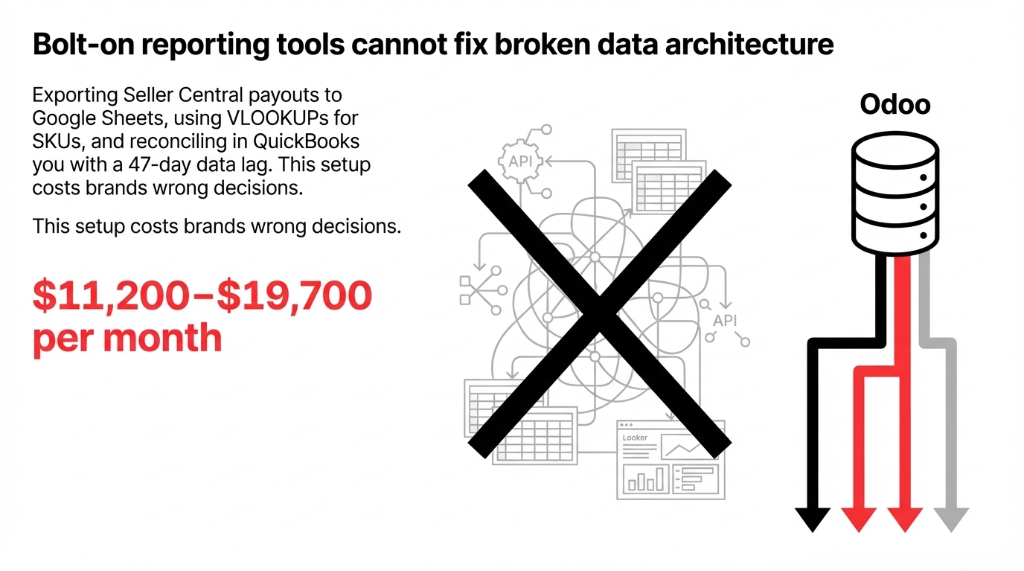
You export Amazon Seller Central payouts into a Google Sheet. Your ops manager runs a VLOOKUP to match SKUs. Your bookkeeper manually enters shipping costs from ShipStation. Your accountant reconciles everything in QuickBooks at the end of the month. And by the time you actually see the numbers, you are 47 days into a pricing decision that was already wrong.
The Real Cost of Bad Data Architecture
That Excel-based setup costs you $11,200 to $19,700 per month in bad decisions. Not in labor costs. In wrong decisions — over-stocking the wrong channel, under-pricing on the wrong platform, and running ads that drive traffic to your least profitable channel.
No bolt-on reporting tool will fix a data architecture problem. You cannot build accurate channel-level P&L on top of a system that was never designed to separate cost flows by channel.
The standard advice is to “use better reporting tools.” So you bolt on a Looker Studio dashboard pulling from five different APIs. Looks great. Updates every 24 hours. And still does not tell you what your actual realized margin is per SKU per channel after every cost is accounted for.
The NetSuite Money Pit
NetSuite will tell you to “configure advanced multi-subsidiary modules.” That is a $180,000 implementation and another 14 months of your life. We have watched three US brands blow past $200,000 in NetSuite customization costs and still not get clean channel-level P&L.
Hidden cost: $200,000+ and still no SKU-level margin by channel without yet another six-figure customization.
How Odoo Channel-Level P&L Actually Works
Odoo handles this differently — and if you configure it correctly, it solves the problem at the data layer, not the reporting layer.
Here is the exact architecture we build for US D2C brands:
Step 1 — Sales Channel Tagging at Order Ingestion
Every order that comes in — whether from Shopify, Amazon, Walmart, or your B2B EDI — gets tagged to its sales channel at the point of order creation. Not at invoicing. Not at month-end. At the moment the order hits Odoo. This is a mandatory configuration step that most vanilla Odoo setups skip, which is why their P&L is still blended.
Step 2 — Channel-Specific Cost Mapping
In Odoo’s accounting module, you define a separate cost journal for each channel. Amazon FBA fees, referral fees, and co-op charges hit the Amazon cost journal. Shopify transaction fees, Shopify Payments processing (2.9% + $0.30 per transaction), and 3PL pick-pack-ship costs hit the Shopify journal. Every dollar of cost is always attributed to the channel that generated it.
Step 3 — SKU-Level COGS Segmentation
Odoo’s inventory valuation — configured with AVCO (Average Cost) or FIFO — calculates COGS per unit at the time of shipment. We map each COGS entry to both the SKU and the channel simultaneously. The result: Odoo knows that SKU-00412 shipped via FBA cost you $14.33 in landed COGS, while the same SKU shipped from your Dallas 3PL cost you $9.87 in landed COGS. Same product. Different true cost. Different channel margin.
Step 4 — The Live Channel-Level P&L Report
Once the above is in place, Odoo’s financial reporting module — filtered by analytic account (which maps to your sales channels) — produces a live P&L per channel. Revenue by channel minus all channel-attributed costs minus channel-specific COGS = true channel-level gross margin. You can drill down from channel to SKU to individual order. In under 4 clicks. Live. No exports. No VLOOKUPs. No 47-day lag.
What the Data Looks Like After You Go Live
We deployed this exact setup for a $4.1M health supplement brand based in Denver, Colorado. They were selling across Amazon FBA, their own Shopify store, and GNC wholesale. Before Odoo channel-level P&L, their blended gross margin was reported at 41.3%.
After 90 days on the new setup, here is what they actually found:
| Channel | True Gross Margin | Monthly Revenue | Monthly Gross Profit |
|---|---|---|---|
| Shopify DTC | 61.2% | $187,000 | $114,444 |
| Amazon FBA | 17.8% | $203,000 | $36,134 |
| GNC Wholesale | 28.4% | $152,000 | $43,168 |
| Blended (Before Odoo) | 41.3% | $542,000 | The number that lied to you |
Real data from a real Denver-based implementation — not vendor slides.
Their “biggest channel” by revenue — Amazon — was generating $36,134/month in gross profit. Their Shopify channel, at $16,000 less in revenue, was generating $78,310 more in gross profit per month.
The 90-Day Impact After Going Live
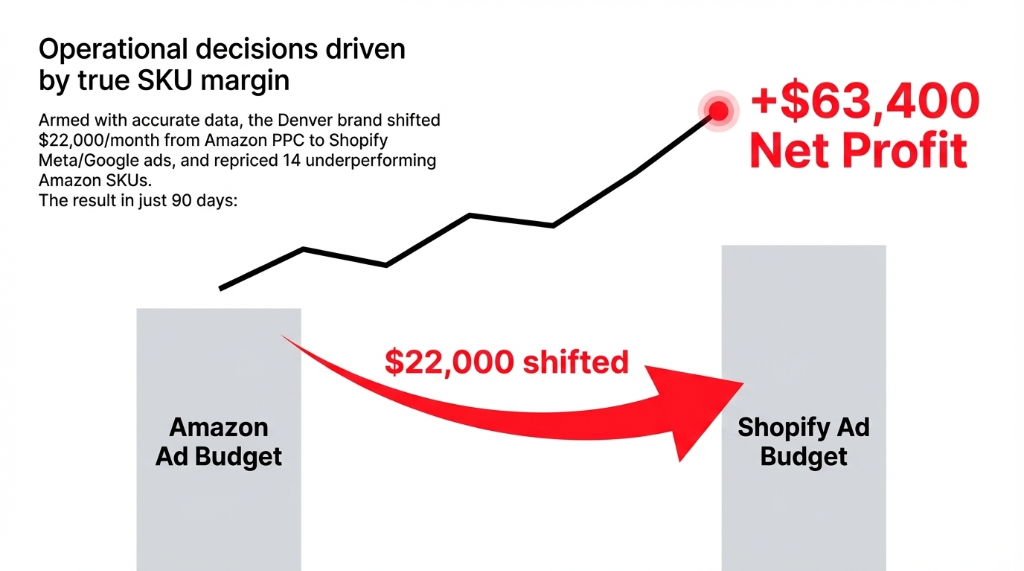
$22,000/mo Reallocated
Shifted from Amazon PPC to Shopify Meta and Google ads based on true channel margin data
14 SKUs Repriced
Underperforming Amazon SKUs repriced upward — Amazon gross profit jumped from $36,134 to $44,200/month
+$63,400 Net Profit
Net additional gross profit in 90 days. Same team. Same products. Same revenue base. Just better data.
The Channels That Fool You the Most
Frankly, Amazon is the most deceptive channel in any multi-channel brand’s portfolio.
The revenue looks strong. Your brand awareness grows. And then you actually look at what Amazon keeps — and the math falls apart.
Here is the cost stack that destroys Amazon margins most US brands never fully account for:
- FBA Fulfillment Fee: $3.22–$8.40/unit depending on size and weight tier
- Referral Fee: 8–17% of selling price depending on category
- Amazon PPC: typically 18–34% ACoS for competitive health, beauty, and home categories
- Inbound FBA Shipping: $0.40–$1.80/unit depending on 3PL location and Amazon destination warehouse
- Storage Fees: $0.87/cubic foot (standard) January–September; $2.40/cubic foot October–December
- Return Processing: $4.80–$11.00 per returned unit including restocking and disposal fees
When you add all of that to your COGS, many brands discover their Amazon channel is their worst margin performer — even when it is their highest revenue channel.
The TikTok Shop Trap
TikTok Shop’s commission structure (currently 2–8% by category) looks cheap. But the return rates on TikTok Shop are running 22–31% for some D2C categories, and that alone can crater a margin that looked healthy before returns.
Without channel-level P&L in Odoo, you will not catch this until it is already Q2 and your cash flow is a mess.
The Implementation Reality (No Sugarcoating)
We are not going to tell you this is a weekend project. It is not.
A proper Odoo channel-level P&L setup — including Shopify-Odoo connector, Amazon SP-API integration, analytic account configuration, COGS mapping, and financial report buildout — takes 6 to 9 weeks for a brand with 3 channels and under 500 active SKUs.
What gets easier immediately (within the first two weeks of go-live):
✓ Order ingestion from all channels stops requiring manual touch
✓ Returns are auto-matched to the originating channel order, so return costs stop polluting your blended margin
✓ Finance team stops spending 31 hours/month on manual reconciliation and starts spending that time on actual analysis
⚠ Watch out: Bad historical data will slow you down. If your SKU master in Shopify has 73 duplicate product variants from years of ad hoc catalog management, the integration will surface that problem on Day 1. (This is a good thing. Painful, but good.)
The Insider Secret Most Odoo Partners Will Not Tell You
Odoo’s analytic accounting module needs to be turned on before you start transacting in the system. If you have been live on Odoo for 18 months without analytic accounts configured, you are going to have to rebuild your channel cost attribution from scratch using journal entry corrections — and that project alone takes 3 to 4 weeks for a $2M+ brand.
Turn it on at go-live. Not later.
Stop Running Your Business on a Blended Lie
Your accountant is not trying to mislead you. QuickBooks is doing exactly what QuickBooks was built to do — track money in and money out at the company level.
But you are not running a company. You are running four different businesses — one per channel — that happen to share the same inventory and the same brand name. Each has different economics, different cost structures, and different margin profiles. And right now, you are managing all four with one blended number that is accurate for none of them.
Odoo channel-level P&L is not a reporting feature. It is an operational decision-making system. The brands that build it correctly — the ones we work with at Braincuber — pull 19 to 31% more gross profit out of the same revenue by making smarter channel and SKU allocation decisions.
You already have the revenue. Stop leaving the margin on the table.
FAQ
Does Odoo support channel-level P&L out of the box?
Odoo’s analytic accounting and multi-channel sales tagging are native features available from Odoo 16 onward. However, getting true per-SKU, per-channel P&L requires deliberate configuration of analytic accounts, cost journals, and inventory valuation rules. Most vanilla Odoo setups skip this entirely. A properly scoped implementation by an experienced partner gets you there without any custom code.
How does Odoo handle Amazon FBA fees in the channel-level P&L?
Via the Amazon SP-API integration, Odoo pulls settlement reports that itemize FBA fulfillment fees, referral fees, storage fees, and co-op charges per order. These are mapped to the Amazon analytic account automatically at settlement import. You see realized fees per SKU per order — not estimated fees — which is the only number that matters for accurate margin calculation.
Can Odoo show margin per SKU across channels simultaneously in one view?
Yes. Using Odoo’s analytic reporting in pivot view, you build a matrix showing gross margin by SKU on one axis and sales channel on the other. You can see in one screen that SKU-00412 earns 58.3% margin on Shopify and 14.1% on Amazon — live, as orders process, with zero manual exports or updates required.
What is the minimum business size where Odoo channel-level P&L makes financial sense?
Any D2C brand doing over $600,000 annually across two or more channels will recover the implementation cost within 90 to 120 days through better pricing and channel allocation decisions. Above $1.5M/year across three or more channels, not having channel-level P&L is actively costing you money every single month you delay.
How long does it take to migrate existing cost data into Odoo for channel P&L reporting?
For a brand with under 800 active SKUs and up to 3 years of historical order data, data migration and validation typically takes 2 to 3 weeks within the 6 to 9-week implementation timeline. The most time-consuming part is cleaning your SKU master — duplicate variants, inconsistent naming, and missing landed cost data are the three most common issues we find in every single migration.
Your P&L Is Lying to You. Find Out by How Much.
Book a free 15-Minute Operations Audit with Braincuber. We will pull up your current channel setup, identify your biggest margin leak in the first call, and show you exactly what your Odoo channel-level P&L would look like. No pitch deck. Just real numbers.