That gap between what the dashboard said and what the bank account showed? That's the trap every omnichannel D2C brand eventually falls into. And it's not a revenue problem. It's a data visibility problem that masquerades as a revenue problem until it's too late.
The Day the Finance Team Had a Breakdown
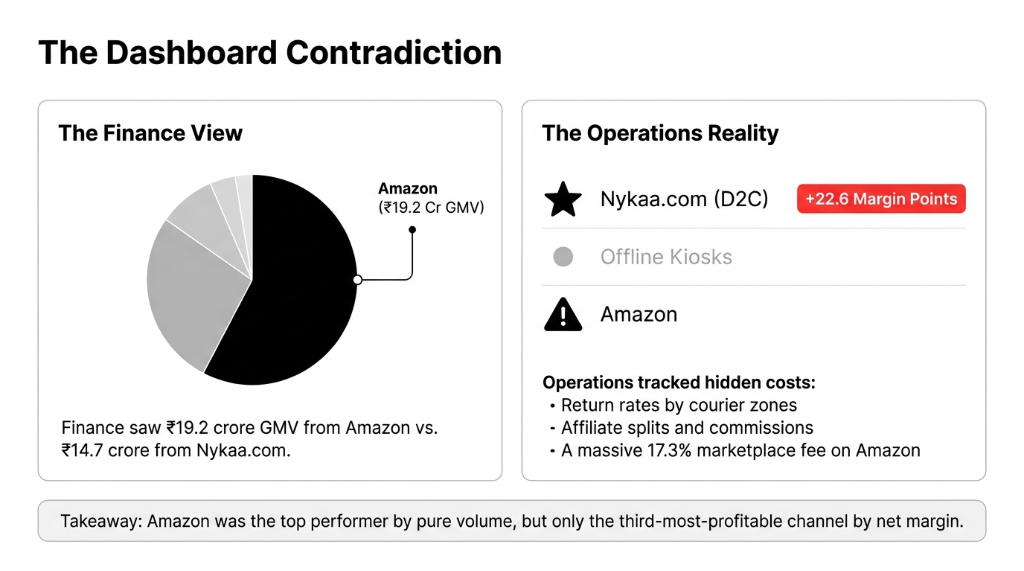
It was a quarterly review. The team pulled up channel-wise GMV — Amazon led at $2.3M, the D2C website followed at $1.76M, and the rest was split across Myntra, Flipkart, and offline kiosks.
The CFO was happy. The operations head was not.
Because the operations head had a different set of numbers. He had return rates by channel. He had logistics cost by courier zone. He had influencer and affiliate commission splits by platform. He had marketplace fee deductions — 17.3% on Amazon, 14.8% on Flipkart, 11.2% on the D2C channel.
When Operations Put Real Numbers Next to GMV
Amazon dropped from the top performer to the third-most-profitable channel. The D2C website emerged as the most profitable by 22.6 margin points.
The room went quiet. Nobody had ever looked at net channel margin in a single view. Every team — finance, operations, marketing — was working off a different spreadsheet, a different tab, a different version of truth.
(Yes, we've seen this at 11 of the last 15 D2C brands we audited. It's embarrassingly common.)
Why Their Existing Tools Were Actively Lying to Them
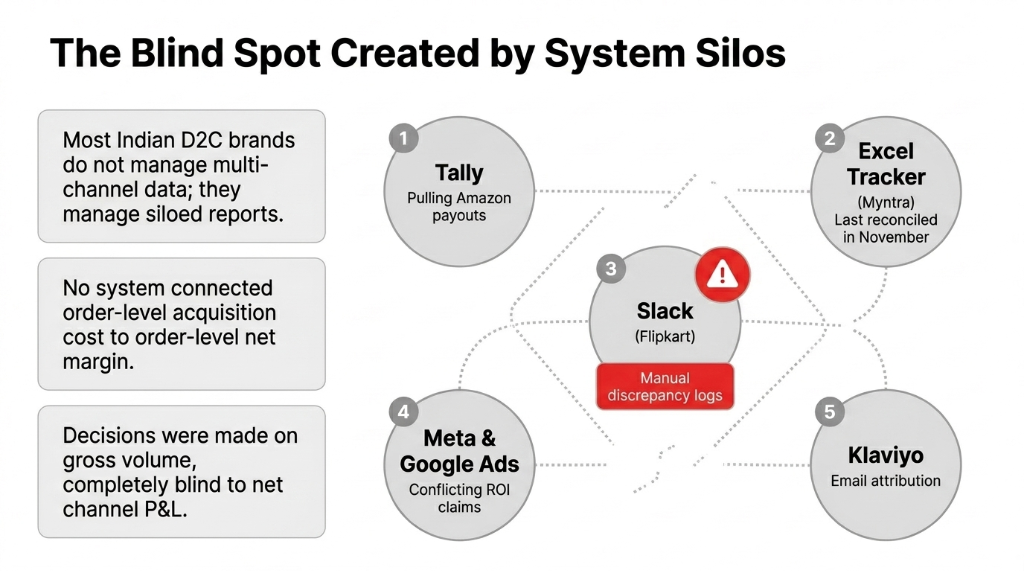
Here's the ugly truth about how most D2C brands manage multi-channel data: they don't. They manage siloed reports.
The 5-System Data Silo Nobody Admits To
Tally
Pulling Amazon payouts. No connection to actual order-level margin data.
Excel Tracker
Myntra data. Last reconciled in November. Nobody owns it.
Slack Threads
Flipkart deductions logged manually by a junior accountant. Discrepancy flags nobody reads.
Meta & Google Ads
Two platforms. Two conflicting ROI claims. No connection to order-level net margin.
Klaviyo
Email attribution for D2C orders. Lives in its own universe.
The Result
Decisions made on gross volume. Completely blind to net channel P&L. $168K/month in Amazon Ads scaling the third-most-profitable channel.
That's $46,000 a month going the wrong direction. And it had been happening for 14 months.
What "Channel Profitability Discovery" Actually Means
Everyone talks about omnichannel like it's a trophy. We treat it like a surgery.
True channel profitability is not GMV minus COGS. It's:
Net Channel Margin =
GMV − Returns − Marketplace Fees − Fulfillment Cost per Order − Channel-Specific CAC − Payment Gateway Charges − Damaged/Lost Inventory − Seller Penalties
Amazon Reality
Blended take rate: 24.7% after fulfillment fees, referral fees, FBA storage, and advertising ACOS. Generating $0.91 net for every $1 of marketing spend. A negative ROI channel. Being scaled with $168K/month of additional ad budget.
D2C Website Reality
Blended cost: 13.1% (Shopify fees + payment gateway + last-mile courier + returns). CAC of $22 per first order via organic SEO and CRM re-engagement. Generating $2.34 net for every $1 of marketing spend.
How Odoo ERP Cracked the Code in 47 Days
When we walked into this engagement, the ask was simple: "Tell us which channel to scale."
Our answer: "Give us 47 days and we'll tell you exactly which channel is eating you alive."
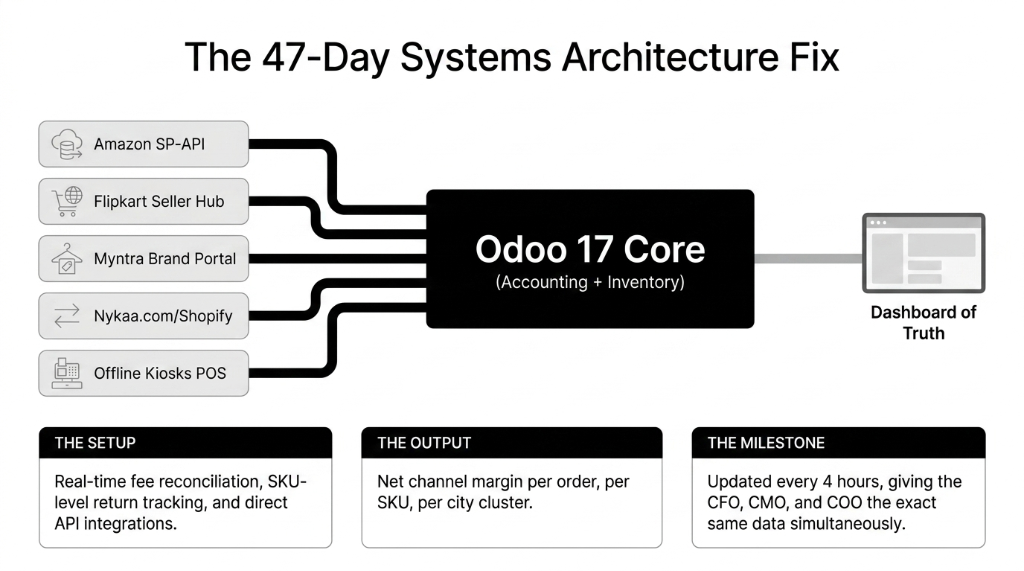
We implemented Odoo 17 ERP with a custom channel profitability module built on Odoo's native accounting and inventory framework. Here's precisely what we connected:
The 5-Channel Integration Stack
Amazon Seller Central → Odoo Accounting: Real-time fee reconciliation, return deductions, and settlement matching at the order level
Flipkart Seller Hub → Odoo Inventory: SKU-level return tracking with condition tagging (resellable vs. destroyed)
Myntra Brand Portal → Odoo Sales: Weekly payout matching with commission auto-deduction
D2C Website (Shopify) → Odoo: Direct Shopify-Odoo integration with order-level CAC pulled from Meta Ads and Google Ads APIs
Offline Kiosks (POS) → Odoo POS: Same-day margin reporting for all 34 physical touchpoints
The result: A single Odoo dashboard showing net channel margin per order, per SKU, per city cluster — updated every 4 hours. For the first time in the company's history, the CFO, CMO, and COO were looking at the same number at the same time.
The Numbers Nobody Expected
| Channel | Monthly GMV | Blended Cost % | Net Margin % | Monthly Net Profit |
|---|---|---|---|---|
| D2C Website | $1.76M | 13.1% | 31.4% | $553K |
| Offline Kiosks | $624K | 18.7% | 27.8% | $173K |
| Flipkart | $612K | 21.3% | 19.6% | $119K |
| Myntra | $336K | 22.9% | 17.3% | $57.6K |
| Amazon ⚠️ | $2.3M | 24.7% | 8.2% | $188K |
Amazon had the highest GMV. Amazon had the lowest net margin percentage. And because $168K/month in Amazon Ads was propping up that GMV, cutting that ad spend by 61% — from $168K to $65K — dropped Amazon GMV by only 17% while adding $103K directly to EBITDA per month.
That one decision, made possible by one Odoo dashboard, improved monthly EBITDA by $46,000 without launching a single new product or hiring a single new person.
The ABM Play That Made This Stick
Here's the part most consultants skip: the discovery alone isn't worth anything if the leadership team reverts to old behaviour in 60 days.
We ran an Account-Based Management (ABM) layer on top of the data:
▸ Each channel got a dedicated P&L owner with a monthly Odoo report tied to their quarterly bonus
▸ The CMO's budget allocation framework was rewritten: new money goes to channels with net margin > 22% first
▸ A "channel health score" was built into Odoo's dashboard — composite of net margin, return rate, and fulfillment SLA — updated daily
▸ Amazon was reclassified from a "growth channel" to a "liquidation and discovery channel" — used to clear slow-moving SKUs and acquire first-time buyers, not to scale hero SKUs
8 months after go-live, the team was still making decisions off the Odoo data — not reverting to the old GMV-first instinct.
What Every D2C CFO Reading This Should Know
We've run 150+ ERP implementations globally. The pattern is always the same.
The brands that scale profitably are not the ones with the most channels. They're the ones who know exactly what each channel costs them — to the rupee, dollar, or dirham — before they spend another cent on scaling it.
We see the exact same channel-profitability blind spot at UK beauty brands running Amazon UK + Shopify + Boots wholesale. At UAE FMCG brands splitting volume between Noon, Carrefour, and their own WooCommerce store. The tools are different. The data silo problem is identical.
If you're running more than two sales channels and you cannot tell us your net margin by channel in under 30 seconds, you have this problem. Right now. Today.
Frequently Asked Questions
How long does it take to set up channel profitability reporting in Odoo?
For a brand running 3-5 channels, a full Odoo channel P&L implementation takes 37-52 days. The first usable dashboard is typically live within 18 days. The timeline depends on how fragmented your existing data sources are — brands on legacy accounting software take 11 days longer on average to migrate cleanly.
Can Odoo connect directly to Amazon Seller Central and marketplace APIs?
Yes. Odoo connects to Amazon Seller Central via the SP-API and to other marketplaces via their respective seller APIs. We build custom connectors where native integrations have gaps. Every connector we build includes automatic fee reconciliation, not just order sync.
What is the difference between GMV reporting and net channel margin reporting?
GMV tells you how much money changed hands on a channel. Net channel margin tells you how much of that money you actually kept after fees, returns, fulfillment, damaged goods, and marketing spend. The gap is usually between 16% and 29% of GMV. That gap — ignored by most dashboards — is exactly where brands make the wrong scaling decisions.
Does this apply to smaller D2C brands or only large enterprises?
It applies from $60K/month GMV upward. Below that, the implementation cost outweighs the benefit. Above $60K/month, the channel-level leakage we typically find covers the full Odoo implementation cost within 60-90 days. The root cause — no net channel P&L visibility — exists at every omnichannel brand regardless of size.
Do we need to replace our existing accounting software to use Odoo?
No. We typically run Odoo as the channel analytics and operations layer while maintaining your existing accounting tool during a 6-month parallel run. After the transition, most brands retire legacy tools for operational accounting but keep them for statutory compliance workflows. QuickBooks users usually migrate fully within 90 days.
The Compounding Cost of Waiting
The longer you wait, the more expensive the fix becomes — not because of implementation costs, but because of compounded opportunity cost. This brand lost 14 months of optimal capital allocation. At $46K/month misallocated, that's $644K that should have gone into D2C growth and instead went into Amazon's margin stack.
Stop Funding Amazon's Margin at Your Own Expense
Book our free 15-Minute Channel Profitability Audit. We'll identify your single biggest channel leak in the first call — no fluff, no pitch deck, just your real numbers.
Book Free Channel Audit