Your store just crashed. You found out from Twitter.
Your Shopify-backed storefront on AWS is generating $200k/month. Then, during a Tuesday evening flash sale, your EC2 instances spike to 94% CPU, your checkout API starts timing out, and your RDS database connection pool maxes out. You find out 14 minutes later — not from a dashboard, but from an angry DM on Instagram.
That 14-minute gap just cost you $163/second. The average revenue-per-second loss for a mid-sized US e-commerce brand during downtime.
That is the real cost of blind AWS monitoring. Not theoretical. Not "up to." We see this number in post-mortems every quarter.
We work with e-commerce teams running stores on AWS across the US, and we see the same pattern constantly: CloudWatch is enabled but not configured. There is a default dashboard, maybe one CPU alarm, and absolutely zero visibility into what actually kills revenue — payment page load times, cart abandonment triggered by slow API responses, or a Lambda function silently failing on 3% of order placements.
The Ugly Truth: You Are Paying for Noise, Not Monitoring
Here is the ugly truth: CloudWatch Logs alone make up 38% of the average CloudWatch bill, and most teams are paying for logs they never read. That is not monitoring. That is expensive noise.
The metrics that matter for e-commerce are not the generic EC2 metrics AWS gives you out of the box. They are application-level signals:
The 4 Revenue-Killing Metrics Nobody Is Watching
▸ Checkout page response time — anything above 2.3 seconds triggers measurable cart abandonment
▸ Payment API error rate — even a 1.4% error rate on a $500k/month store = $7,000/month in lost transactions
▸ RDS connection saturation — the silent killer during flash sales that does not show up on CPU charts
▸ Lambda cold start frequency — especially brutal for cart and search microservices running on serverless
Why "Just Turn On CloudWatch" Is Dangerous Advice
Everyone in an AWS blog tells you to "enable CloudWatch monitoring." Cool. Done. Now what?
Here is what they don't tell you: the default CloudWatch metrics have a 5-minute granularity. Your flash sale dies in 90 seconds. By the time the default alarm fires, you have already lost $14,700 in abandoned carts.
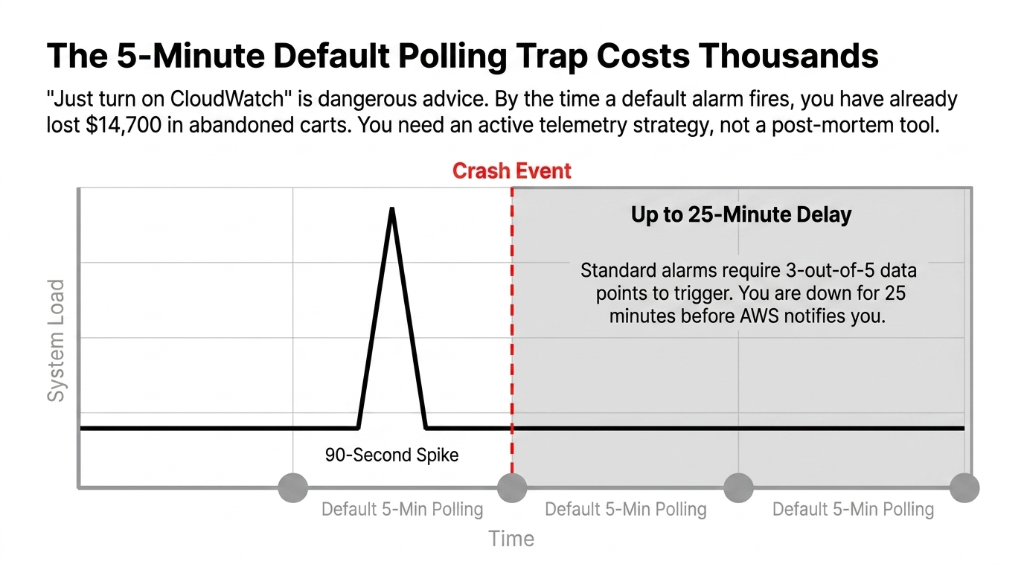
You need detailed monitoring (1-minute intervals) enabled on every EC2 instance serving your storefront. This is not automatic — it costs an extra $3.50/instance/month and nobody mentions it.
AWS CloudWatch alarms default to an "OK" state until enough data points accumulate. If you configure an alarm with a 5-minute period and a 3-out-of-5 datapoint threshold, you are waiting up to 25 minutes before a notification fires. That is not a monitoring strategy. That is a post-mortem tool.
The CloudWatch Stack That Actually Protects Revenue
We build a three-layer monitoring architecture for every e-commerce client on AWS. Here is exactly what it looks like:
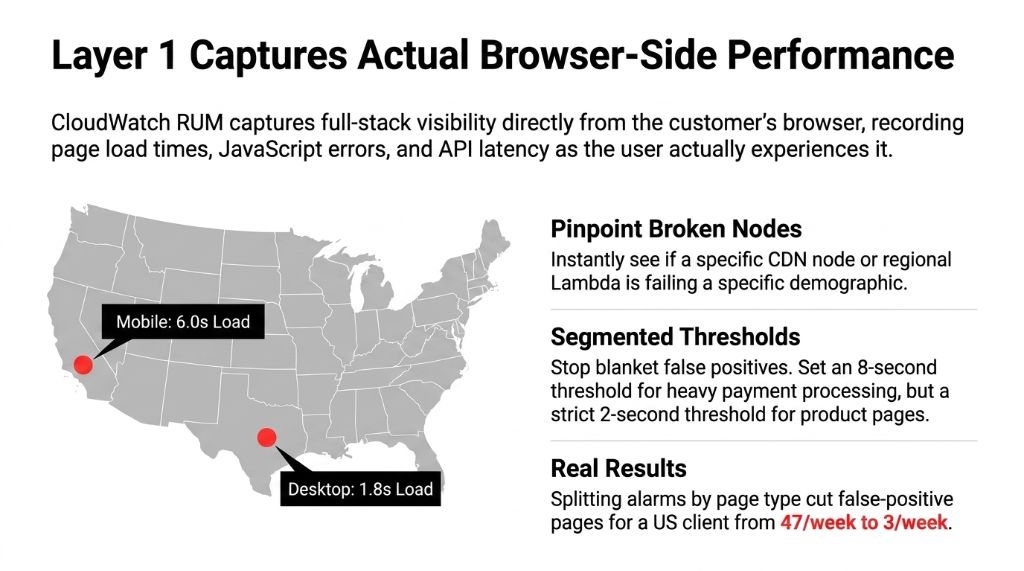
Layer 1: CloudWatch RUM (Real User Monitoring)
CloudWatch RUM captures actual browser-side performance data from real users — page load times, JavaScript errors, API call latency — and ships it into CloudWatch Logs. This is how you know what your customers actually experience, not what your server thinks they experience.
Insider Fix: Segmented Alarm Thresholds
A US-based e-commerce client we onboarded was firing false alarms on every checkout because they had set a blanket 2-second threshold for all pages. Payment processing legitimately takes longer than a product page. We split the alarm by page type — 8-second threshold for checkout, 2-second threshold for product pages.
Result: False-positive alerts dropped from 47/week to 3/week
You can also segment RUM data by device type and US geography. If mobile users in California see 6-second checkout loads while desktop users in Texas load at 1.8 seconds — you know exactly which CDN node or Lambda region is breaking.
Layer 2: CloudWatch Metric Filters + Custom Metrics
Your application logs are already going to CloudWatch Logs (or they should be). Metric filters let you extract business KPIs from those logs — not just infrastructure metrics. This is the layer that catches the silent revenue killers — events that do not show up on CPU charts but are bleeding your conversion rate.
Custom Metric Filters We Configure for Every Store
Payment Failures
Count of "payment_failed" log events per minute. Fire alarm at 5+ per minute.
Cart Timeout Abandonments
Track "cart_abandoned_due_to_timeout" entries. Correlate against API latency spikes.
Lambda p95 Latency
Extract order processing time from Lambda logs. Alert when p95 exceeds 4.2 seconds.
Layer 3: CloudWatch Alarms with Metrics Insights
CloudWatch Metrics Insights lets you write SQL-like queries across all your resources simultaneously. Instead of creating 23 separate alarms for 23 EC2 instances in your auto-scaling group, you write one query:
SELECT AVG(CPUUtilization) FROM SCHEMA("AWS/EC2") GROUP BY InstanceId
One alarm. Automatically covers every new instance your Auto Scaling group spins up. No manual alarm updates when you scale out for Prime Day or Black Friday.
The Black Friday Configuration You Need 6 Weeks Before
Frankly, we have seen more e-commerce infrastructure failures during predictable traffic spikes than during random incidents. Black Friday is not a surprise. Prepare your CloudWatch setup like it is not.
1. Enable Contributor Insights on API Gateway
Shows you the top 10 IPs hammering your endpoints. This is how you catch bot traffic before it saturates your WAF budget. Most stores do not discover bot traffic until they are reviewing a $4,200 WAF bill post-sale.
2. Set Up Composite Alarms
Do not get paged because a single metric blips. Get paged when CPU > 75% AND request error rate > 2% AND RDS connections > 80% simultaneously. This alone cuts false-positive pages by 60-70%.
3. Configure Anomaly Detection on Order Counts
If orders drop 40% below the ML-predicted baseline at 3 PM on Black Friday, something is broken. CloudWatch Anomaly Detection tells you in real time — not 45 minutes later when your CEO texts you.
4. Pre-Warm Your Dashboards
CloudWatch dashboards have their own latency at high query volumes. Switch to high-resolution (1-second) metrics for the 72-hour sale window at roughly $0.30/metric/month. Worth every penny when you are watching $14,700/minute flow through your checkout.
What This Setup Actually Costs (No Fluff)
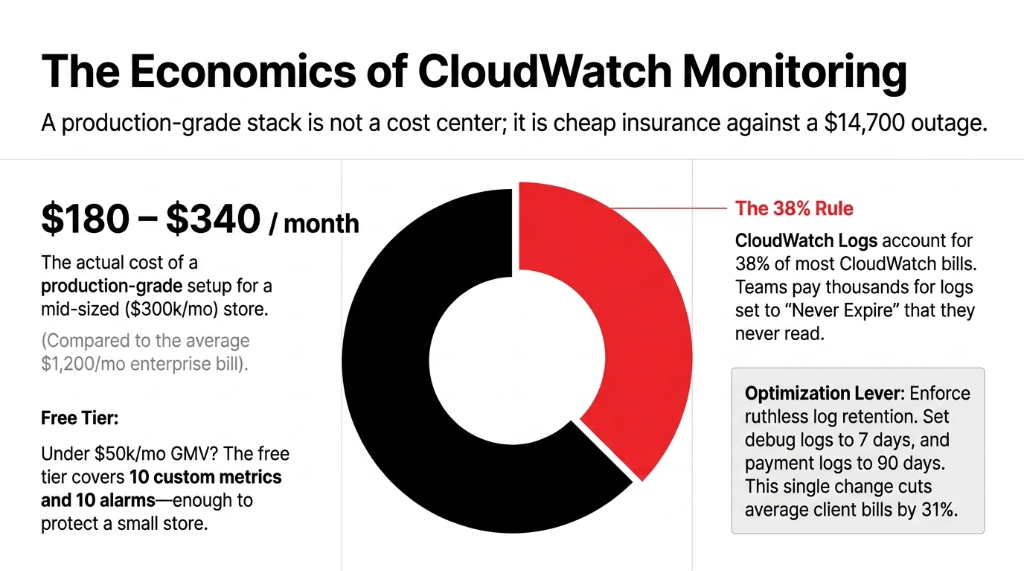
The average monthly CloudWatch spend per enterprise AWS account is $1,200. For a mid-sized e-commerce store doing $300k/month in GMV, a properly configured CloudWatch monitoring stack runs between $180 and $340/month, depending on log volume and number of custom metrics.
The #1 Cost Optimization Lever
CloudWatch Logs account for 38% of most CloudWatch bills — which means the #1 lever to cut cost without losing coverage is log retention policy. Set non-critical logs (debug-level application logs) to a 7-day retention. Set payment and checkout logs to 90 days.
Real Result: We cut client CloudWatch bills by 31% just by enforcing retention policies
Most teams had every log group set to "Never Expire" by default. Thousands of dollars per year on logs nobody will ever read. (Yes, your DevOps lead will be embarrassed.)
Free tier covers 10 custom metrics, 10 alarms, and 1 million API requests per month. For a small store under $50k/month GMV, you can run meaningful monitoring inside the free tier if you prioritize ruthlessly. Do not let anyone tell you monitoring requires a $500/month commitment from day one.
The Integration Nobody Talks About: CloudWatch + Auto Scaling
Here is an insider point most AWS blog posts skip entirely: CloudWatch alarms are the trigger mechanism for EC2 Auto Scaling. If your scaling policies are attached to default CPU metrics with 5-minute granularity, your store will start dropping requests 4-7 minutes before new instances come online during a traffic spike.
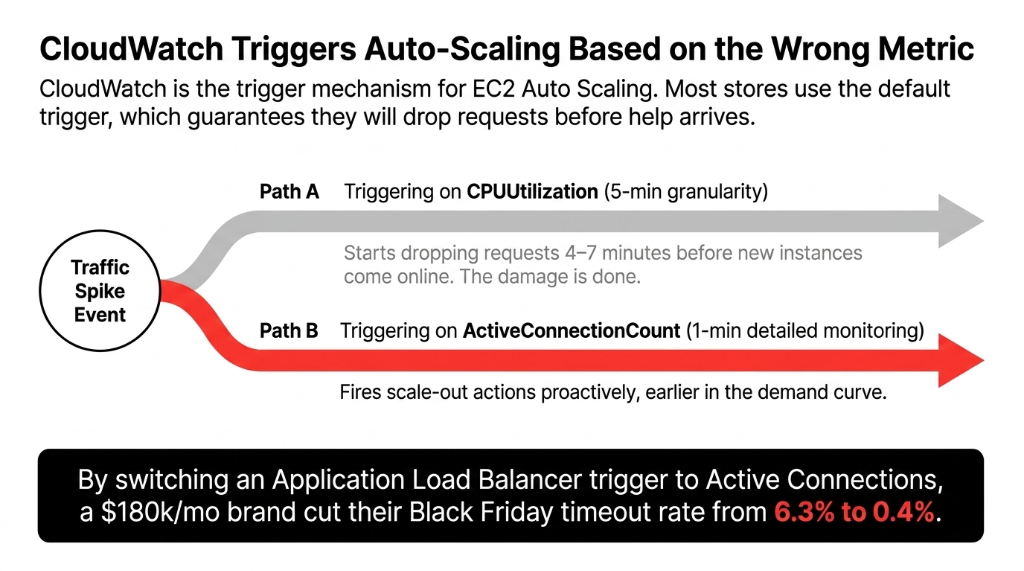
The fix is to switch your Auto Scaling trigger from CPUUtilization to a custom metric: ActiveConnectionCount on your Application Load Balancer, set at 1-minute detailed monitoring. This fires your scale-out action earlier in the demand curve, not after the damage is done.
The Auto Scaling Fix in Numbers
Before: CPUUtilization Trigger
5-min granularity. Drops requests 4-7 minutes before new instances arrive. 6.3% timeout rate on Black Friday.
After: ActiveConnectionCount
1-min detailed monitoring. Fires proactively earlier in demand curve. 0.4% timeout rate on Black Friday.
Client: US Home Goods Brand
$180k/month revenue. Single config change. Timeout rate dropped from 6.3% to 0.4%. Zero code changes needed.
Stop Flying Blind. Here Is Your 48-Hour Fix.
If you do nothing else this week, do these three things:
Step 1: Enable CloudWatch RUM on checkout and payment pages
20 minutes of setup. Immediate visibility into real user experience. You will finally know if that "site is fine" claim from your DevOps team is actually true.
Step 2: Create one Composite Alarm
Fire only when CPU + error rate + DB connections all spike simultaneously. This alone will cut false-positive alerts by 60-70%. Stop waking up your on-call engineer at 3 AM for a CPU blip that resolved itself.
Step 3: Set log retention policies on every log group
Go to CloudWatch Logs, sort by size, and set anything non-critical to 14-day retention. This takes 15 minutes and typically saves $200-$400/month. (Your finance team will send you a thank-you Slack.)
If your AWS team cannot walk you through this in 48 hours, that is a signal too.
Frequently Asked Questions
Does AWS CloudWatch monitoring work with Shopify stores on AWS?
Yes. If your Shopify backend — APIs, Lambda functions, RDS, or EC2 instances — runs on AWS, CloudWatch monitors all of it. CloudWatch RUM also captures frontend performance data from your storefront's browser sessions, giving you full-stack visibility from user click to database response.
How quickly does CloudWatch detect an e-commerce site outage?
With detailed monitoring enabled at 1-minute intervals and properly configured alarms, CloudWatch can detect and alert on an outage in under 2 minutes. The default 5-minute standard monitoring can take up to 25 minutes to fire an alarm — which is why switching to detailed monitoring is non-negotiable for revenue-critical stores.
What does CloudWatch cost for an e-commerce site?
A production-grade CloudWatch setup for a mid-sized e-commerce store runs $180 to $340 per month, depending on log volume and custom metric count. The free tier covers 10 custom metrics and 10 alarms, which is enough for a basic setup on stores under $50k/month GMV.
Can CloudWatch alert me before my site crashes during a flash sale?
Yes. Using CloudWatch Anomaly Detection on order count metrics and Auto Scaling triggers based on Application Load Balancer connection counts, you can proactively scale infrastructure before traffic peaks cause outages. This requires 1-minute detailed monitoring, not the default 5-minute interval.
How is CloudWatch RUM different from regular CloudWatch metrics?
Standard CloudWatch metrics measure server-side infrastructure like CPU, memory, and DB connections. CloudWatch RUM measures real user experience — actual page load times, JavaScript errors, and API latency as seen by browsers. For e-commerce, RUM tells you a customer's checkout is slow. Standard metrics just tell you your server is fine.
Your Store's Revenue Depends on What You Can See
If your team found out about the last outage from a customer complaint instead of a dashboard — your monitoring stack has a gap. We will find your biggest CloudWatch blind spot on the very first call.
Free audit. CloudWatch config reviewed. Alarm gaps identified on the first call.