What This Audit Covers
1. What that 34/100 actually measures (hint: not your website)
2. The 7 specific structural failures dragging your score down
3. Why "just install a cache plugin" is terrible advice ($1.3M brand case study)
4. The honest 34-to-85+ timeline from our last 11 performance overhauls
5. Real revenue impact: $22,700 revenue increase in 60 days, same ad spend
What That 34/100 Actually Means
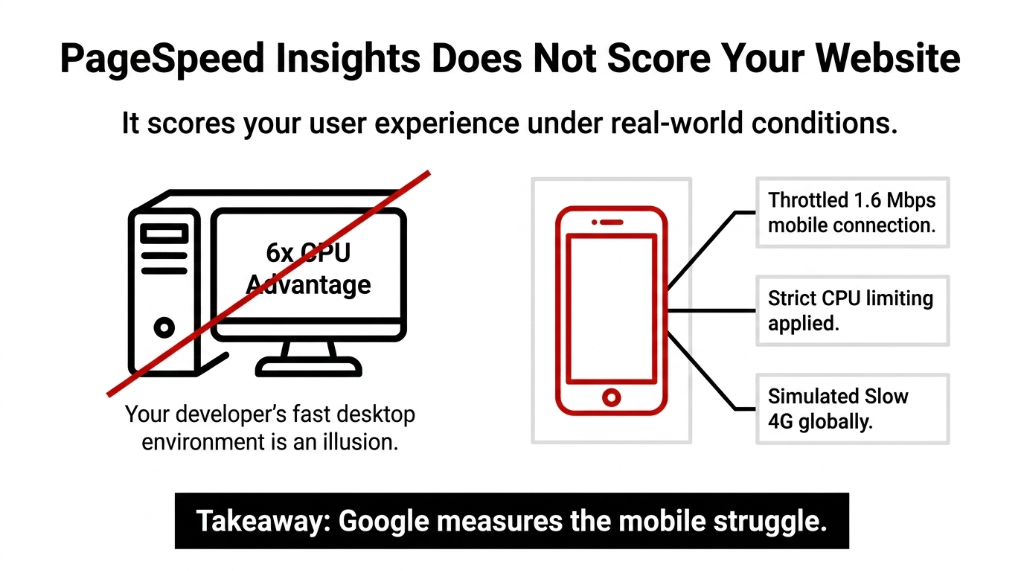
PageSpeed Insights does not score your "website." It scores your user experience under real-world conditions — specifically, a throttled 1.6 Mbps mobile connection with CPU limiting applied.
Google uses five weighted metrics to calculate that score:
| Metric | Good Threshold | Your Likely Reality at 34/100 |
|---|---|---|
| LCP (Largest Contentful Paint) | ≤ 2.5s | 5s-9s |
| FCP (First Contentful Paint) | ≤ 1.8s | 4s+ |
| TBT (Total Blocking Time) | ≤ 200ms | 800ms-3,000ms |
| CLS (Cumulative Layout Shift) | ≤ 0.1 | 0.3-0.6 |
| INP (Interaction to Next Paint) | ≤ 200ms | 500ms+ |
A 34/100 means you are failing all five. Google requires 75% of your real users to meet the "good" threshold for each metric individually. You are not even close. LCP alone drags most sites down — the 2025 Web Almanac confirmed only 62% of mobile origins pass a good LCP score. You are in the other 38%.
The 7 Real Reasons Your Score Is 34
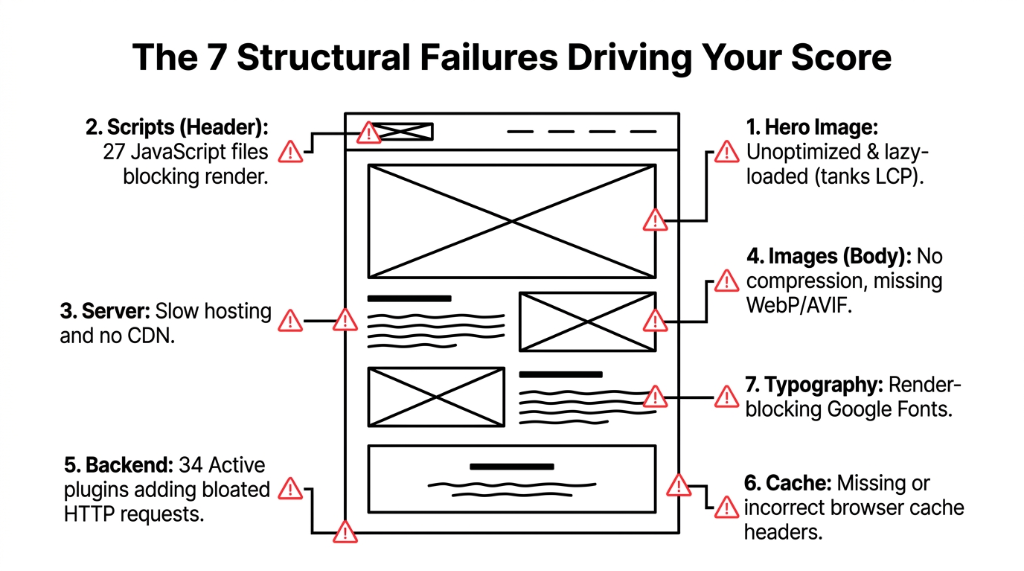
1. Your Hero Image Is Unoptimized and Lazy-Loaded
That 3.8MB JPEG banner at the top of your homepage? Google's crawler finds it late, loads it even later, and your LCP tanks to 7+ seconds. Lazy-loading the hero image is one of the most common self-inflicted wounds we see. On your most important element — the one Google measures for LCP — it does the exact opposite of what you intended.
2. You Are Loading 27 JavaScript Files Render-Blocking Your Page
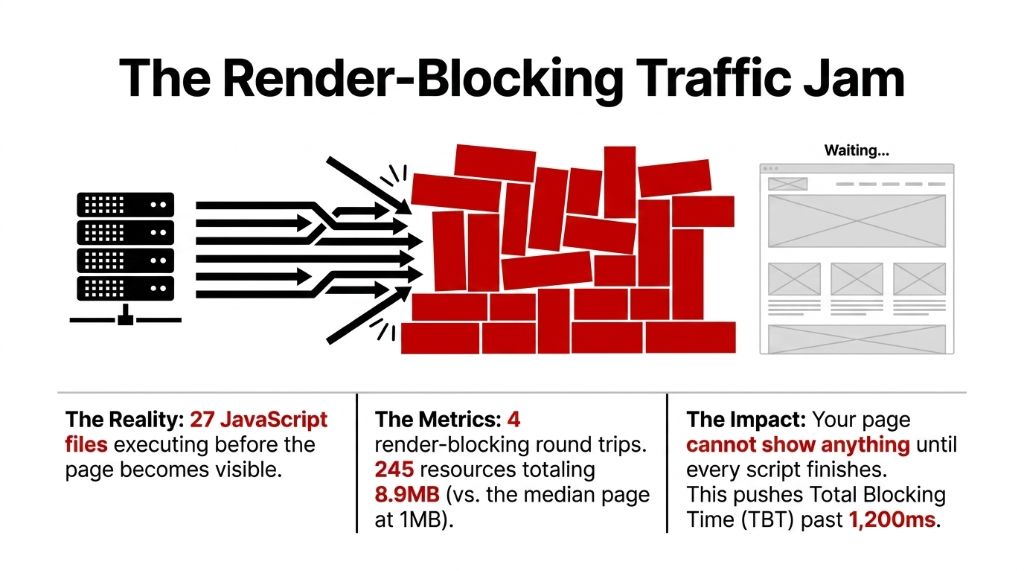
(Yes, we know your developer said "it's fine on desktop." Desktop has a 6x CPU advantage over the mobile simulation Google uses. It is not fine.)
3. Your Hosting Is Slow and You Are Not Using a CDN
TTFB — Time to First Byte — above 800ms is the invisible killer. It means your server is slow to respond before any content even starts loading. CDN implementation alone cuts TTFB by 60-80% — but most brands running on cheap shared hosting or an unoptimized WordPress stack never bother.
4. No Image Compression, No Next-Gen Formats
Still serving PNGs and JPEGs instead of WebP or AVIF? You are sending 3x-5x more data than necessary. A 400KB product image in WebP delivers the same visual quality at 85KB. Multiply that across 18 product images on a category page and you have just added 5.7MB of dead weight to every page load.
5. Your WordPress Has 34 Active Plugins
Every plugin adds HTTP requests, JavaScript, and CSS that loads on every page — even pages where the plugin does nothing. WooCommerce + Elementor + Slider Revolution + three abandoned SEO plugins you forgot to delete = a site that loads like it is running on a 2009 server.
6. No Browser Caching or Incorrect Cache Headers
If your cache-control headers are missing or set to no-store, every visitor — including your loyal customers — downloads every asset from scratch, every time. Return visitors should load your site in under 1 second with correct caching.
7. Fonts Are Blocking Render
Google Fonts loaded via a standard <link> tag in your <head> block text from rendering until the font file downloads. On a slow 4G connection, that font file adds 300ms-900ms of invisible delay to your FCP. Use font-display: swap and preload your font files.
Why "Just Install a Cache Plugin" Is Terrible Advice
Everyone on Reddit tells you to install WP Rocket or W3 Total Cache and call it done. Here is what actually happens: cache plugins optimize a small subset of issues — primarily browser caching and some minification. They do nothing about your unoptimized images. They do not fix your slow hosting. They do not restructure your render-blocking JavaScript. They do not touch your TTFB.
Case Study: D2C Fashion Brand, $1.3M/Year
Setup: WP Rocket installed, premium theme, Cloudflare free CDN. PageSpeed score? 31/100.
Root Cause: Hero image loaded via CSS background-property instead of an <img> tag — Google's preload scanner could not find it at all. LCP: 6.8 seconds.
One change — move hero to <img> with fetchpriority="high"
LCP dropped from 6.8s to 2.1s. That is not a plugin fix. That is surgery.
What a 34 to 85+ Score Journey Actually Looks Like
This is not a "submit your sitemap and wait" situation. Here is the honest timeline from our last 11 site performance overhauls:
Week 1: Audit & Triage (34 to 45)
Identify top 3 LCP killers. Implement fetchpriority="high" on hero image. Convert images to WebP at 82% quality. Switch Google Fonts to font-display: swap + preload.
Week 2: Server & Hosting Layer (45 to 62)
Move to faster host (Cloudways, Kinsta, or Hetzner with Nginx). Implement full-page caching. Set up Cloudflare Pro. Enable Brotli compression (37% smaller than Gzip).
Week 3-4: JS & CSS Cleanup (62 to 83+)
Audit and remove unused plugins (we typically kill 9-14 per site). Defer non-critical JavaScript. Remove unused CSS (PurgeCSS: 400KB to 18KB). Fix CLS with explicit width/height on all images.
Result: Last Client Audit
PageSpeed mobile: 34/100 to 87/100 in 23 days. Bounce rate dropped 31.4%. Revenue up $22,700 in 60 days vs. prior period — same ad spend.
The Score vs. Reality Trap
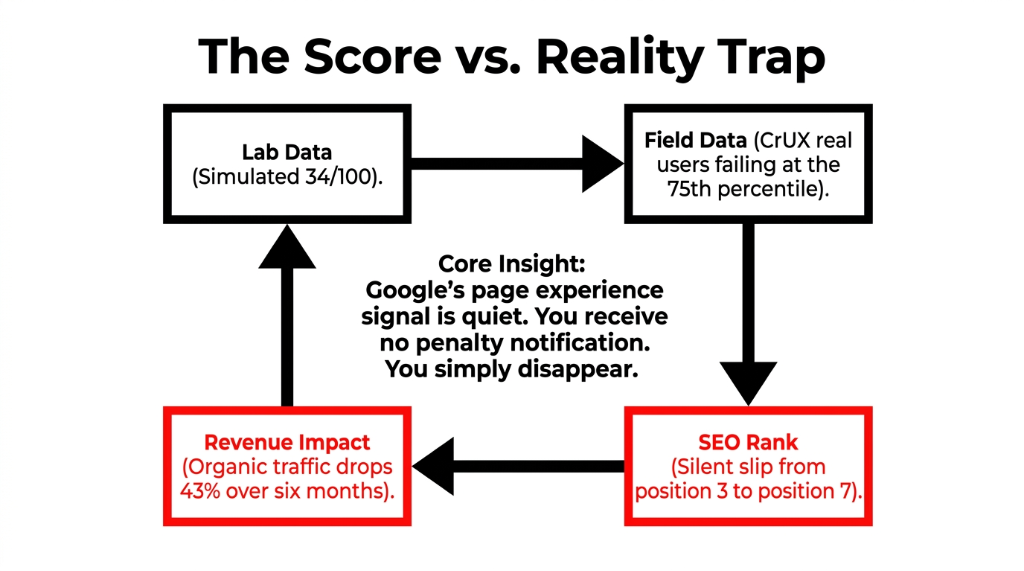
Google ranks your site based on its field data (CrUX), which is real user performance collected from Chrome users. If your real users on real networks are failing LCP at the 75th percentile, Google sees it — regardless of what your analytics says.
A 3-second page load increases bounce probability by 32%. At a 34/100 score, you are almost certainly loading in 5+ seconds on mobile for a significant portion of visitors.
You lose rankings before you even know it. Google's page experience signal is quiet. You do not get a penalty notification. You just slowly slip from position 3 to position 7, and your organic traffic drops 43% over six months. (Yes, we have seen this exact story more than once.)
Real Numbers: What Fixing This Is Worth
| Current Score | Avg Load Time (Mobile) | Est. Bounce Rate | Conversion Loss vs. 90+ |
|---|---|---|---|
| 34/100 | 6.8s | ~72% | ~35%+ |
| 55/100 | 4.1s | ~51% | ~21% |
| 75/100 | 2.6s | ~38% | ~9% |
| 90+/100 | 1.2s | ~26% | Baseline |
For a store doing $50,000/month, moving from 34/100 to 90+/100 is the difference between $50,000 and approximately $67,500/month — without spending a single additional dollar on ads.
The Braincuber Bet
Run your site through pagespeed.web.dev right now on mobile. If the number is below 50, you are losing money you cannot see.
We will find the top 3 bottlenecks and tell you exactly what the fix looks like — in 15 minutes. We cap these at 10/week. We go deep, not wide.
Stop Bleeding Traffic to Faster Competitors
Book our free 15-Minute Performance Audit. We'll identify your top 3 speed killers in the first call.
Book Your Free Performance AuditFrequently Asked Questions
Does a low PageSpeed score directly hurt my Google rankings?
Yes. Google uses Core Web Vitals — LCP, INP, and CLS — as direct ranking signals under its Page Experience update. Sites failing these thresholds lose rankings to faster competitors with equivalent content. If 75% of your real users fail even one metric, you are penalized.
Can I fix a 34/100 PageSpeed score without a developer?
Partially. You can compress images, switch to WebP, and install a basic caching plugin yourself. But fixing render-blocking JavaScript, TTFB issues, or server-side cache headers requires developer access. Most sites below 40/100 need at minimum 12-20 hours of technical work.
How long does it take to improve from 34 to 80+?
Based on our last 11 audits, 3-4 weeks is the realistic timeline — assuming hosting, image pipeline, and JavaScript issues are all addressed systematically. Quick wins in Week 1 alone typically push the score to 45-50.
Will switching to Shopify from WordPress automatically improve my score?
Not automatically. Shopify's infrastructure is faster than cheap WordPress hosting, but a bloated Shopify theme with 14 third-party apps and an unoptimized hero image will still score 38/100. Platform matters less than implementation quality.
Does PageSpeed score affect my Google Ads cost-per-click?
Yes. Google's landing page experience component of Quality Score is directly influenced by page speed. Slow landing pages receive a "Below Average" rating, which increases your CPC and reduces your ad position — you pay more for worse placement.