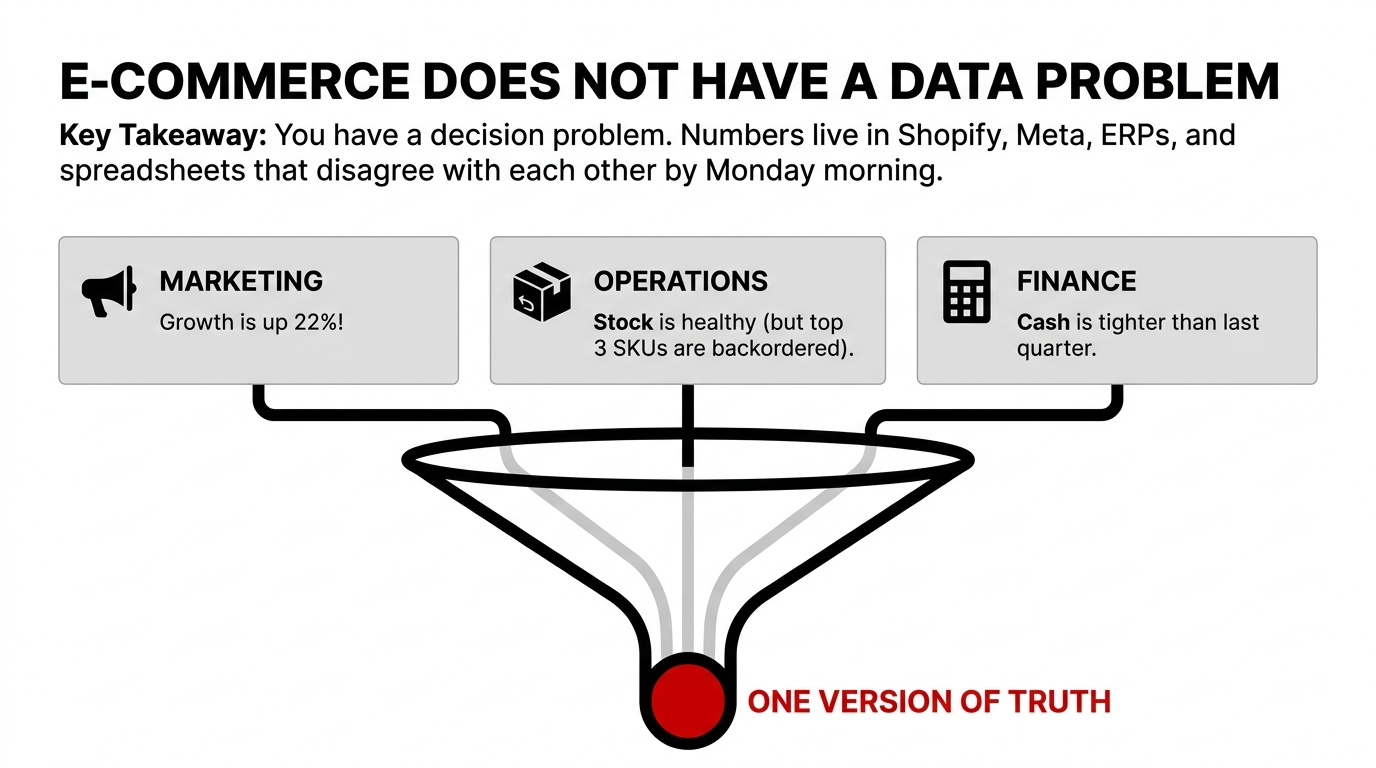
Your marketing team says growth is up 22%. Your ops lead says stock is healthy. Your finance team says cash is tighter than last quarter. They are all looking at different spreadsheets. And they are all wrong.
That is not a data problem. It is a decision problem. E-commerce businesses generate revenue numbers in Shopify, ad spend in Meta, traffic in Google Analytics, inventory in ERPs, and shipping in third-party tools. By the time leadership sees them, the numbers have been copy-pasted through three departments and nobody agrees on the answer.
Impact: Teams waste an estimated $23,000 to $47,000 annually arguing over mismatched reports while decisions go stale and margin leaks quietly into the P&L.
AWS QuickSight for E-Commerce Business Intelligence is the fastest way to turn messy sales, ad, inventory, and customer data into decisions your team can act on before the next bad SKU, stockout, or margin leak hits your P&L. It matters because QuickSight combines AI-powered dashboards, broad data-source connectivity, and enterprise security controls in a single AWS-native BI layer.
Why E-Commerce Teams Get Stuck
Most e-commerce businesses do not have a data problem. They have a decision problem, because their numbers live in Shopify, Amazon, Meta Ads, Google Analytics, ERP exports, shipping tools, and spreadsheets that disagree with each other by the time leadership opens them on Monday morning. QuickSight becomes valuable when it sits on top of a warehouse like Amazon Redshift and gives one version of truth for revenue, traffic, conversion, CAC, returns, and inventory movement.
That is where the pain starts. A founder sees revenue up, but profit down. The ops lead sees inventory "available," but the warehouse is already short. The marketing team celebrates a campaign, while finance discovers that ad spend ate the margin. QuickSight helps unify those views into dashboards that are easier to share and explore across teams.
What QuickSight Actually Does
QuickSight is AWS's business intelligence platform for building interactive dashboards and exploring data without forcing everyone to live in SQL all day. AWS now positions it as AI-powered BI that transforms scattered data into strategic insights, with conversational exploration, application integrations, and enterprise-grade governance.
For e-commerce, the practical value is simple. You connect your warehouse, create datasets, and build dashboards that track channel performance, product performance, cohort behavior, fulfillment timing, and return patterns. AWS documentation and ecosystem examples show QuickSight commonly connected to Redshift for visualization and analytics workflows, which is a standard architecture for e-commerce BI on AWS.
The E-Commerce Dashboard Stack
A useful e-commerce BI setup usually has four layers. QuickSight is strongest when it is not treated as a standalone tool. It works best after your data is already structured, because then teams can slice by channel, product line, geography, return reason, or customer cohort without constantly asking analysts for new extracts.
A Practical QuickSight Architecture
| Layer | Purpose | Typical AWS Fit |
|---|---|---|
| Data sources | Storefront, ads, finance, shipping, support | Shopify, Amazon, Meta, GA4, ERP, CSV feeds |
| Storage & modeling | Clean, join, and standardize records | S3, Glue, Redshift |
| BI layer | Dashboards, alerts, ad hoc analysis | QuickSight |
| Governance | Access control, auditing, compliance | IAM, CloudTrail, RLS, VPC controls |
AWS also documents dashboard embedding, row-level security, domain allow-listing, and dataset-level access controls, which matter when different teams or external partners should not see the same data.
Security and Control
This is where QuickSight fits the "AWS Security Deep Dives" angle. The platform is designed for controlled distribution of dashboards, and AWS documents several mechanisms that matter in real environments: row-level security, domain allow-listing for embedding, IP restrictions, dataset permissions, IAM-based access, SSO integrations, and auditing support through AWS services like CloudTrail.
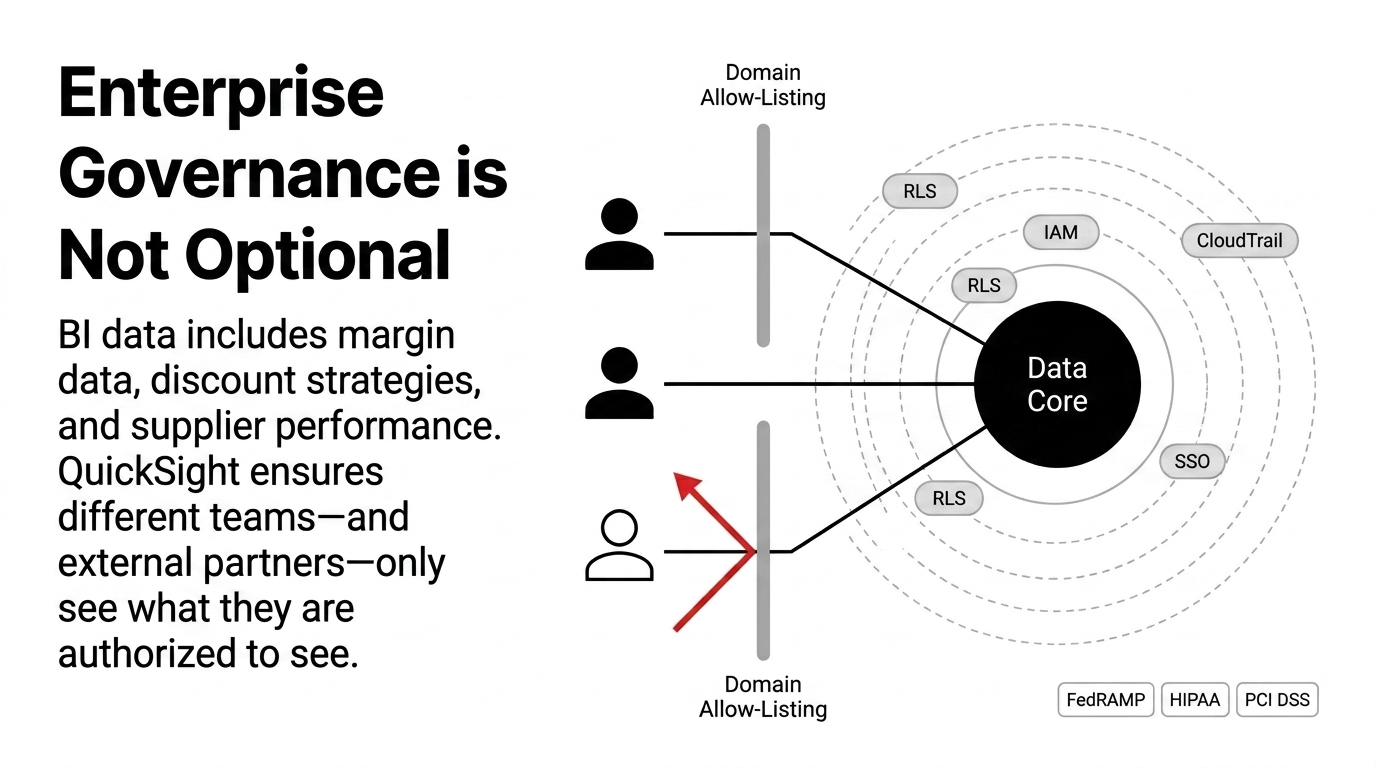
That matters in e-commerce because BI data is not just "sales data." It often includes customer behavior, margin data, discount strategy, inventory position, supplier performance, and sometimes payment-related operational information. AWS states that QuickSight can support compliance objectives including FedRAMP, HIPAA, PCI DSS, ISO, and SOC requirements, which is a strong signal for businesses that need governance, not just charts.
Pricing Reality
QuickSight is often attractive because its pricing model can be more flexible than traditional enterprise BI stacks. Public pricing references show user-based options that start low for readers, with higher tiers for authors and pro users, and some capacity-based session pricing for larger embedding use cases. That said, pricing changes over time, and e-commerce teams should model total cost across authors, readers, SPICE storage, and embedding sessions before they roll it out broadly.
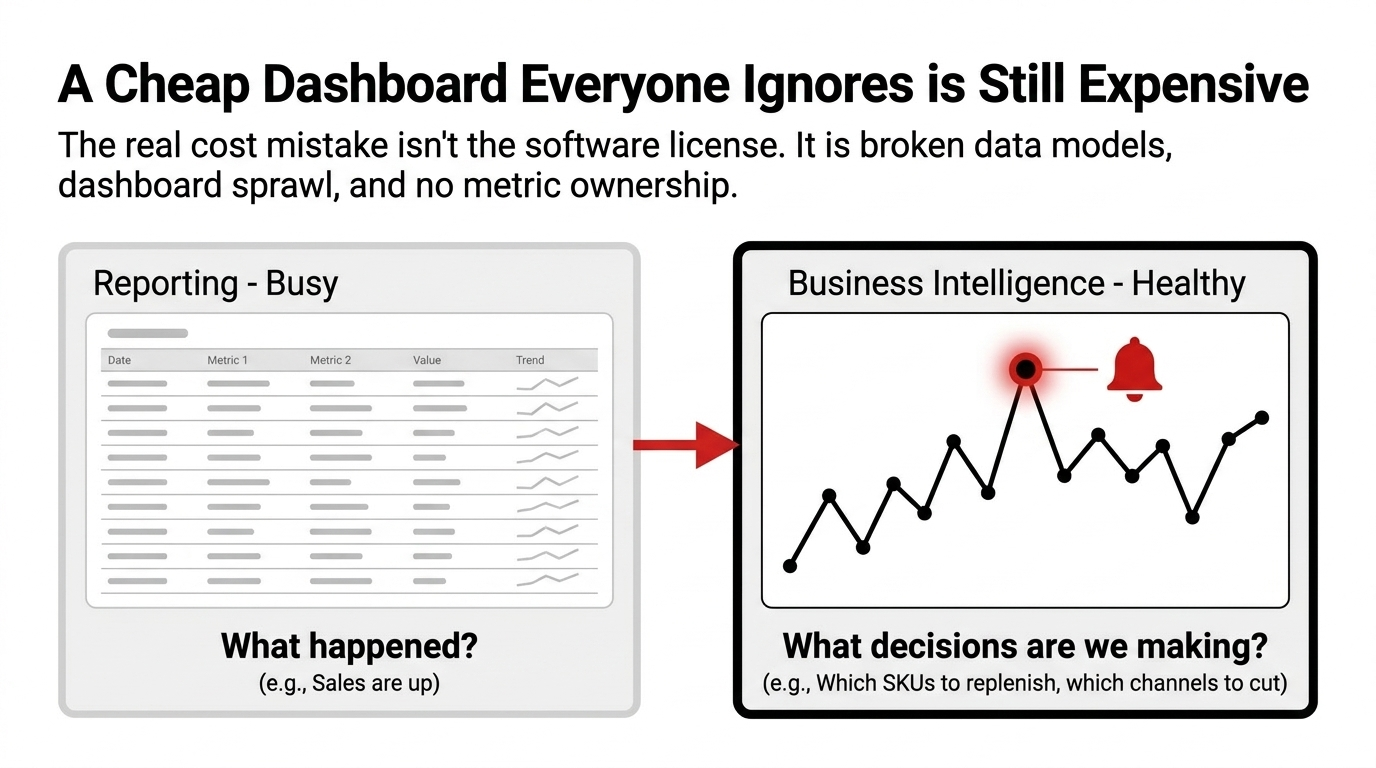
The real cost mistake is not the license line item. It is paying for a BI tool and then leaving the hard work undone: broken source mappings, poor data models, no ownership for metrics, and dashboards nobody trusts. A cheap dashboard that everyone ignores is still expensive.
Story of the Real Value
Picture a mid-sized D2C brand selling apparel across Shopify, Amazon, and paid social. Marketing reports 22% growth, but finance says cash is tighter than last quarter. The warehouse says stock is "healthy," yet the top three SKUs are already on backorder. That brand does not need more meetings. It needs one live operating layer.
With QuickSight connected to a modeled warehouse, the company can build a dashboard for net revenue by channel, contribution margin by SKU, return rate by size, sell-through by warehouse, and order-to-ship time by region. Once the team can see that a $48 hero product is generating 31% of revenue but only 8% of gross margin because of returns and expedited shipping, the conversation changes immediately. The business stops arguing over numbers and starts fixing them.
What to Track First
If an e-commerce team is starting from zero, these are the first dashboards that actually matter. Do not start with 40 vanity charts. Start with the eight numbers that decide whether the business is healthy or just busy.
The 8 Numbers That Decide Everything
1. Revenue by Channel
Which channels actually drive net revenue, not just top-line sales.
2. Gross Margin by SKU
Not just revenue. Which SKUs actually contribute margin after returns and shipping.
3. CAC vs Contribution Margin
Does your marketing spend actually pay for itself? Or is it burning cash?
4. Return Rate by Product & Size
Returns kill margin. Are specific sizes or products driving the problem?
5. Inventory Cover by Warehouse
Days of stock on hand. Not "available" counts. Actual cover.
6. Order-to-Ship Time
Speed is a competitive advantage. Where are you slow?
7. Repeat Purchase Rate by Cohort
Are new customers coming back? Or is CAC a one-time cost with no payback?
8. Discount Dependency by Product Line
Are you training customers to wait for sales? Or are discounts strategic?
QuickSight is useful because it lets teams explore these measures interactively, rather than waiting for a weekly PDF nobody reads.
Common Mistakes
Most QuickSight rollouts fail for boring reasons. The first is bad data modeling, where teams connect raw tables and expect a clean answer. The second is dashboard sprawl, where every manager asks for their own version of the truth. The third is ignoring access control, which turns BI into a security headache instead of a management tool.
Another mistake is buying BI before deciding the operating questions. E-commerce leaders should define the decisions first: which SKUs to replenish, which channels to cut, which regions to stock, and which campaigns to scale. Then the dashboard is built to support those decisions. That is the difference between reporting and business intelligence.
The Mistake List That Kills BI Deployments
1. Connecting raw tables without modeling -- garbage in, garbage out. 2. Dashboard sprawl -- every manager builds their own version of truth. 3. Ignoring access control -- margin data visible to everyone. 4. Buying BI before defining decisions -- charts that answer no question. 5. No metric ownership -- nobody owns the number, so nobody fixes the number.
Hidden cost: $23,000 to $47,000 per year in analyst hours, missed decisions, and unaddressed margin leaks.
Implementation Path
A sensible implementation follows a clean sequence. This is not a "set it and forget it" tool. The value compounds when the metric model is maintained. AWS's own positioning around unified intelligence and business outcomes makes the point clearly: QuickSight is meant to bridge the gap between insight and action, not just display numbers.
The 7-Step Implementation Sequence
1. Consolidate source data into a warehouse. 2. Standardize product, order, customer, and channel IDs. 3. Build curated tables for finance, marketing, ops, and CX. 4. Apply row-level security and dataset permissions. 5. Design role-based dashboards for each team. 6. Add alerts or scheduled delivery where needed. 7. Review metrics monthly and remove unused charts.
Reality check
Most teams skip steps 1-3 and wonder why their dashboards are wrong. Start with clean data. The rest follows.
When QuickSight Makes Sense
QuickSight is a good fit when you are already on AWS or want a BI layer that works well with AWS storage and security controls. It is especially sensible if your e-commerce business has multiple teams, multiple data sources, or embedded analytics needs for partners, vendors, or customers. It is less ideal if you have no warehouse, no metric definitions, and no owner for data quality.
For e-commerce leaders, the real question is not "Should we buy BI?" It is "How much money are we losing because our team sees the business too late?" Once the answer is uncomfortable, QuickSight stops looking like software and starts looking like infrastructure.
Braincuber Insider Note
Braincuber Technologies helps e-commerce teams deploy AWS QuickSight as part of a controlled BI and analytics architecture. We build Redshift data models, QuickSight dashboards, and row-level security rules that turn scattered data into a single operating layer. Our Cloud Consulting Services handle the warehouse, ETL, and governance so your team focuses on decisions, not data plumbing.
Stop Arguing Over Spreadsheets. Start Fixing the Business.
If your e-commerce team is still copy-pasting numbers between Shopify, Meta, and ERP exports, you are not analyzing the business. You are building a case for why decisions take three weeks instead of three minutes. QuickSight is not magic. But if you treat it as part of a structured BI system, it becomes an actual operating layer, not just a chart generator.
Free 15-Minute BI Architecture Review
We will review your current data sources, identify the eight numbers that actually matter for your business, and recommend the QuickSight architecture that turns scattered reports into a single operating layer. No pitch deck. Just the architecture that actually works.
FAQ: AWS QuickSight for E-Commerce
How secure is QuickSight for e-commerce data?
QuickSight supports role-based access, IAM, SSO, CloudTrail auditing, private networking options, and row-level security for embedded or shared content.
Can QuickSight handle multiple stores or channels?
Yes. It is commonly used with centralized warehouses like Redshift, which makes it practical for brands running Shopify, Amazon, ads, and ERP data together.
Is QuickSight only for AWS-native data?
No. It works best with AWS data stores, but it can also connect to multiple enterprise and third-party sources through supported integrations and modeled datasets.
What is the main benefit for e-commerce teams?
The main benefit is one trusted dashboard layer for revenue, margin, returns, inventory, and channel performance, so teams stop arguing over spreadsheet versions.
Is QuickSight expensive for small teams?
It can start relatively low for reader use cases, but total cost depends on authors, readers, SPICE storage, and embedding usage, so the full model should be planned first.