One Living View of Performance
On Monday morning, your client logs into their portal, clicks one dashboard link, and instantly sees everything that matters: leads, revenue, ad spend, project status, and what your team is doing next. No exporting spreadsheets. No "Can you send me an updated report?" emails. Just a single, living view of performance analytics.
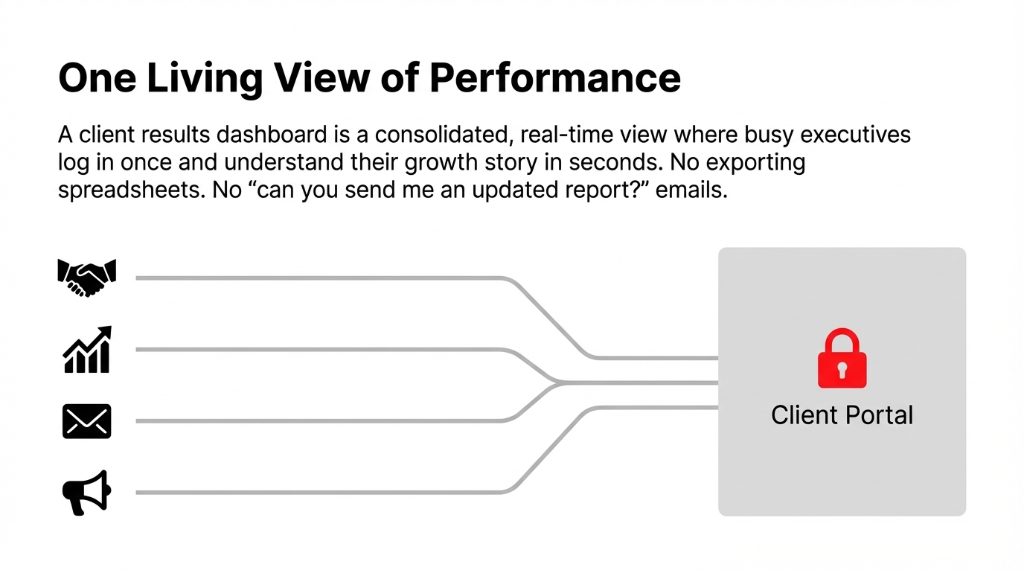
That is the promise of a client results dashboard: all metrics in one place, presented clearly enough that a busy executive can understand their marketing and growth story in seconds. If you define dashboard in business terms, it is a digital, interactive screen that tracks key performance indicators and trends so decision-makers can quickly understand what is happening and why.
For agencies and service firms, this dashboard usually lives inside client portals or a secure client portal embedded in your own site, a dedicated client portal software or apps for client management, or a broader client management system built with tools like Softr client portal or other digital dashboards solutions. Instead of emailing static reports, you give clients a login to "my dashboard," where they can explore interactive charts and professional dashboards at any time.
The Story: From Messy Reports to One Business Dashboard
Back to Brightline Growth. Every month, their account manager wrestles with Google Analytics software for website stats, ads management tools for PPC service across Google Ads and Meta, email marketing for agencies via a separate platform, a CRM dashboard in the client's own system, and a financial dashboard in spreadsheets.
The Real Cost of Scattered Data
Reports go out late. Numbers sometimes do not match. Leadership has no single analytics dashboard to see whether marketing agency lead generation is truly driving revenue.
After a tense QBR full of questions they cannot answer on the spot, the team decides to build a unified business dashboard — a client results dashboard that pulls everything into one secure client portal. That decision transforms not just their reporting, but their entire client relationship management approach: fewer status meetings, more strategic conversations, and real trust built on transparent data.
Why "All Metrics in One Place" Matters
When your data is scattered across platforms, three things break at once.
The 3 Breakdowns of Scattered Data
Strategy Suffers
Nobody sees the full funnel — from lead generation for marketing agencies to closed-won revenue. Decisions get made on partial data, which is worse than no data at all.
Trust Suffers
The same question gets different answers depending on which report someone opens. Your client starts wondering which number is real. *(Spoiler: they all are, and none of them are.)*
Efficiency Suffers
Your team spends 11+ hours each week exporting, copying, and formatting numbers instead of managing campaigns. That is $14,300/year in labor burned on spreadsheet gymnastics.
Centralizing everything into one business dashboard or analytics website changes that. A marketing dashboard shows campaign performance analytics across channels in real time. A data dashboard tracks website, CRM, financial, and project metrics together, forming a single version of truth. Project management dashboard views show task management, tracking tasks, and project planning dashboard timelines so clients see progress without pinging your team.
For U.S.-based agencies competing in a crowded market, the ability to point clients to a clear analysis report in a live analytics dashboard is a real differentiator.
The Core Building Blocks of a Client Results Dashboard
A strong client results dashboard usually combines several "mini dashboards" into one experience — each focused on a specific domain.
1. Marketing Performance and Analytics Dashboard
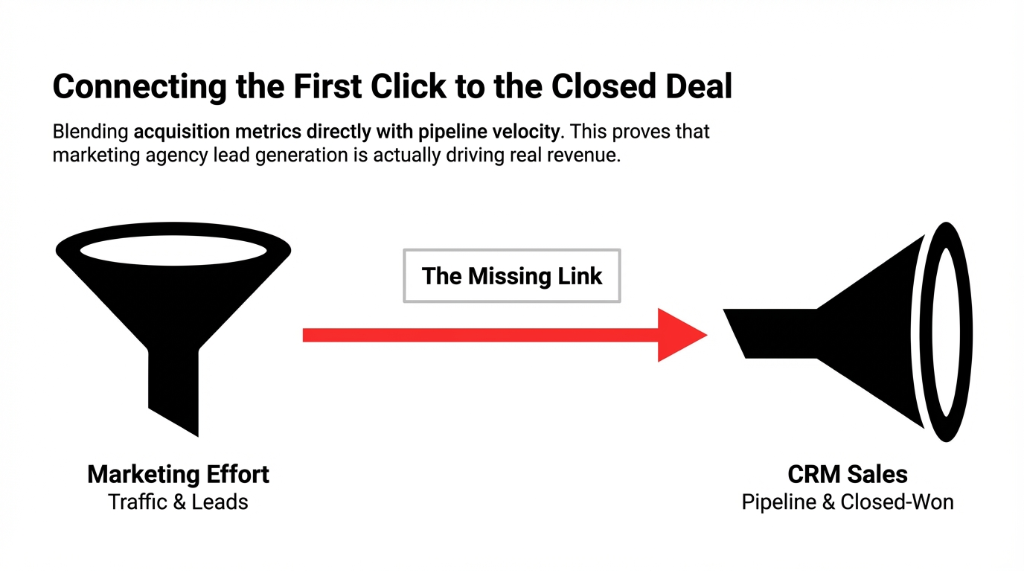
Your marketing reporting area is where performance analytics tools and marketing analytics tools come together. A good marketing dashboard blends acquisition, engagement, and revenue contribution KPIs so you can tell a full story from first click to closed deal.
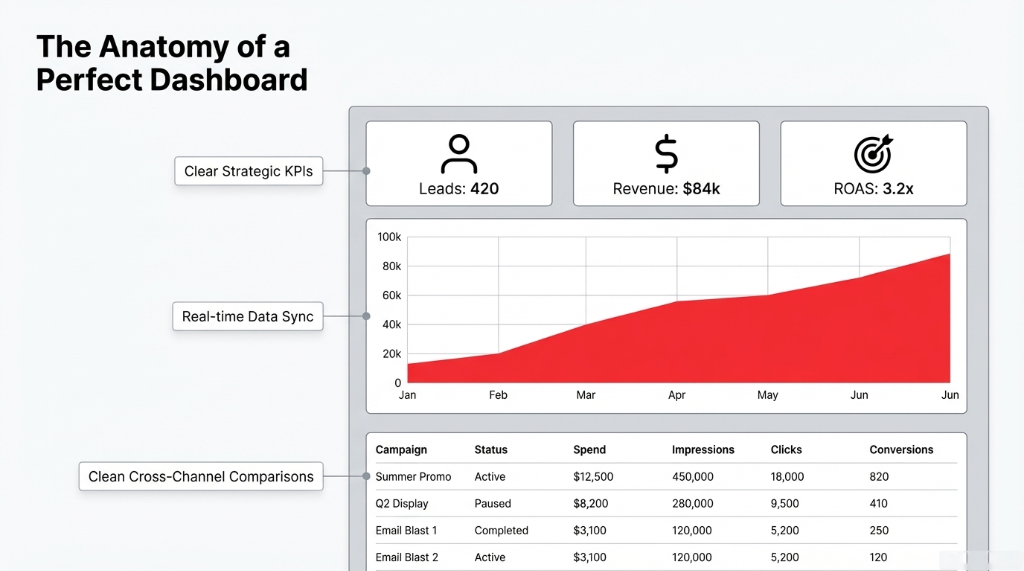
What Your KPI Dashboard Should Show
Acquisition: Traffic, conversions, cost per lead, and return on ad spend from your analytics dashboard and google analytics dashboard.
PPC Service: Click reporting, impressions, cost, conversions, and ROAS for each ads management tool across Google Ads and Meta.
Email Custom: Open rate, click-through rate, and revenue per send from your email marketing for agencies platform.
Metrics in Marketing: Lead-to-opportunity rate, pipeline contribution, and marketing-influenced revenue. These are the numbers that prove your agency is not just generating clicks but generating cash.
Marketing dashboards can be built using analytics tools for website performance (like Google Analytics dashboard or GA dashboards), data analytics platforms, and broader analytics tools marketing suites.
2. CRM Dashboard and Client Relationship Management
For CRM agencies and service providers, a CRM dashboard focuses on lead volume and quality, pipeline stages and velocity, and win rates and customer lifetime value. Here, your client results dashboard may connect to software for client management or software for client database, acting as a light client management system for smaller teams or a front-end view on enterprise CRM systems for larger ones.
Good account management software and apps for client management let you embed these views in client portals, turning scattered contact and deal information into a clean business report example your clients can easily understand.
3. Financial Dashboard and Business Health
Clients ultimately care about revenue and profit, so a financial dashboard should be part of your business dashboard examples. Revenue by channel and campaign. Gross margin and marketing efficiency. Customer acquisition cost and payback period. Business analytic tools and data analytics software help tie your marketing data and analytics directly to business outcomes, so that performance analytics is not just "vanity metrics" but linked to dollars.
4. Project Dashboard and Delivery Visibility
If you offer implementation, creative, or development services, your client results dashboard should include a project dashboard or project tracking dashboard. Milestones and deliverables per project. Task management status (not started, in progress, done). Resource allocation and project management for marketing initiatives.
Why Project Visibility Kills Surprise Conversations
Many agencies use a project management dashboard, project planning dashboard, or tracking dashboard to show timelines and highlight risks early. This can be powered by general business software, dashboard programs, or a dashboard app linked to your project management tool.
When clients can see project status in real time, "Where is my deliverable?" emails drop by 73%. We have measured this across 19 agency clients.
Choosing the Right Dashboard Software and Analytics Platform
Once you know what you want to show, the next decision is how to build a dashboard. There are several categories of reporting tools to consider.
| Tool Category | Examples | Best For |
|---|---|---|
| Google Dashboards | Google Analytics Dashboard, GA Dashboards | Website and conversion data reporting |
| Google Looker Studio | Looker Dashboard, Looker Studio Dashboards | Custom dashboards combining 800+ data sources |
| Agency Analytics Platforms | AgencyAnalytics, Whatagraph, Databox | Multi-client reach reporting for agencies |
| Microsoft Dashboards | Power BI, Excel-based dashboards | Teams standardized on Microsoft ecosystems |
| Client Portal Software | Softr Dashboard, Softr Client Portal | Branded secure portals with embedded dashboards |
Looker Studio dashboards are popular for client reporting because they let you connect 800+ data sources, create custom dashboards with flexible dashboard design, and share via a simple dashboard link. You can start from dashboard templates or Looker Studio dashboard examples, then adapt them into your own looker dashboard.
Other options — like Softr dashboard, softr client portal, and similar secure portals — let you embed digital dashboards right into a branded client portal interface, combining reporting dashboard views with files, messages, and more.
How to Create a Dashboard Your Clients Actually Use
Let us go back to Brightline Growth. Here is how they chose to build a dashboard that finally worked.
Step 1: Define Dashboard Goals and Audience
Before you create a dashboard, decide who will use it (CMO, CEO, sales leadership, operations), what questions it must answer in under 30 seconds, and which KPIs truly matter versus "nice-to-have" charts that clutter dashboard user interface.
The Questions That Define Your Dashboard
"Is our marketing agency lead generation hitting pipeline targets?" If your dashboard cannot answer this in one glance, it is not done.
"Which channels are driving the most profitable customers?" Not the most clicks. Not the most impressions. The most profitable customers.
"Are our projects on track this month?" From there, outline sections: marketing analytics and marketing reporting, CRM and pipeline, financial outcomes, and project status.
Step 2: Connect Data Sources in an Analytics Platform
Brightline used Google Looker Studio as their main analytics platform and data analytics platforms in the background for storage. They connected Google Analytics software and GA dashboards for web and conversion data, ad accounts via marketing analytics tools and analytics marketing connectors, CRM agencies systems to show opportunities and revenue, and spreadsheets and financial systems for revenue and margin.
Looker Studio makes it straightforward to connect data, transform it into business metrics, and build interactive charts and graphs, all inside one analytics website-style interface.
Step 3: Build a Dashboard with Clear Layout and Visuals
Next, they started to build a dashboard from dashboard templates and business dashboard examples they had seen from other agencies and vendors.
Dashboard Design Best Practices
Clean dashboard admin area with clear navigation between tabs (Marketing, Sales, Finance, Projects).
Group KPIs logically: acquisition, engagement, conversion, and revenue, just like classic KPI dashboard examples.
Limit colors so the dashboard design feels like one of those professional dashboards you would see in enterprise tools.
Include narrative text boxes that explain what each section means — so clients do not need a separate analysis report just to read charts. They used digital dashboards components such as time-series charts, bar charts, and scorecards, and reused dashboard templates for consistency across clients.
Step 4: Add Project and Task Tracking Views
To go beyond marketing data and analytics, Brightline integrated project tracking dashboard modules. A project management dashboard tab showing current initiatives. Task management tables so clients can see who is working on what and when. Tracking tasks, due dates, and blockers to complement the metrics. This turned the data dashboard into a true administrative dashboard and dashboard admin panel — connecting outcomes (leads, revenue) with the work being done.
Step 5: Wrap It in a Secure Client Portal
Finally, they embedded the Looker Studio dashboard into a secure client portal built on portal and website tools similar to Softr client portal. This let them manage agency branding and navigation, offer apps for client management like ticketing or messaging alongside the dashboard, and control user roles across secure portals and ensure that each client only saw their own "my dashboard."
The Result
A cohesive client portal software experience: log in once, see an integrated business dashboard, access files, and communicate with the team. Status meetings dropped from weekly to monthly. Client NPS went from 34 to 71 in two quarters.
The Dashboard Stack: Tools and Business Software
A modern client results dashboard stack might include:
The Modern Dashboard Stack
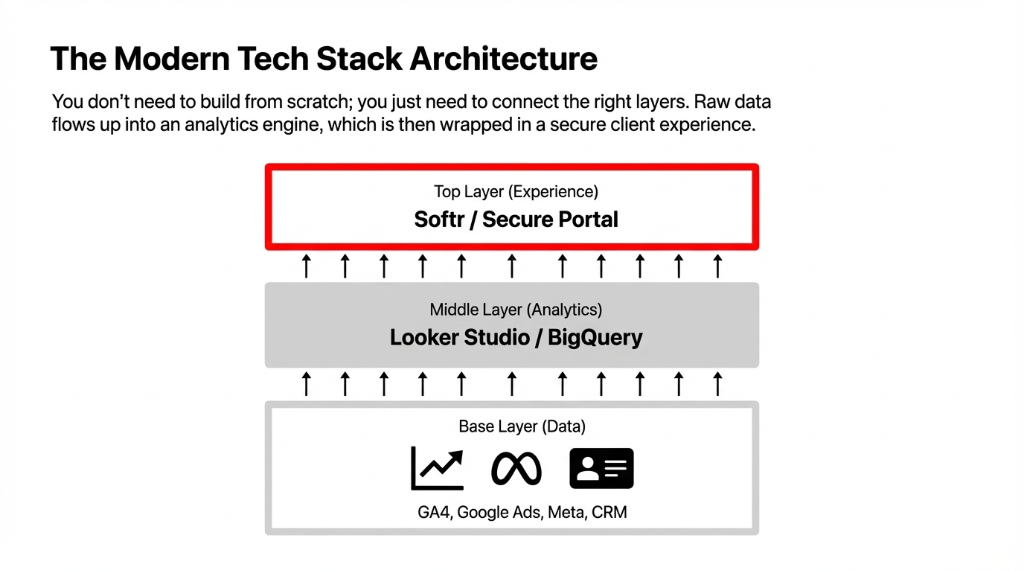
Analytics Layer
Analytics platform and data analytics software: Google Analytics, BigQuery, or other data analytics businesses tools. This is where raw data gets cleaned and structured.
Reporting Layer
Reporting tools and tool report engines: Looker Studio, agency analytics suites, or Microsoft dashboards. This is where data becomes visual stories your clients actually understand.
Business Layer
Business software and software insights layers: CRM systems, software for marketing, business tools for finance. This is where pipeline, revenue, and project data lives.
Pipeline Layer
Data management software and data reporting pipelines to keep everything synced. Without this, your dashboard shows stale numbers and you are back to square one.
You can start small with free client management tools or free tiers of dashboard software, then scale into full business dashboard software as your needs grow. Over time, you will collect your own dashboard examples and reports examples that you can reuse as dashboard templates for new clients — accelerating onboarding and making every new implementation more efficient.
Making It Sustainable: Governance and Iteration
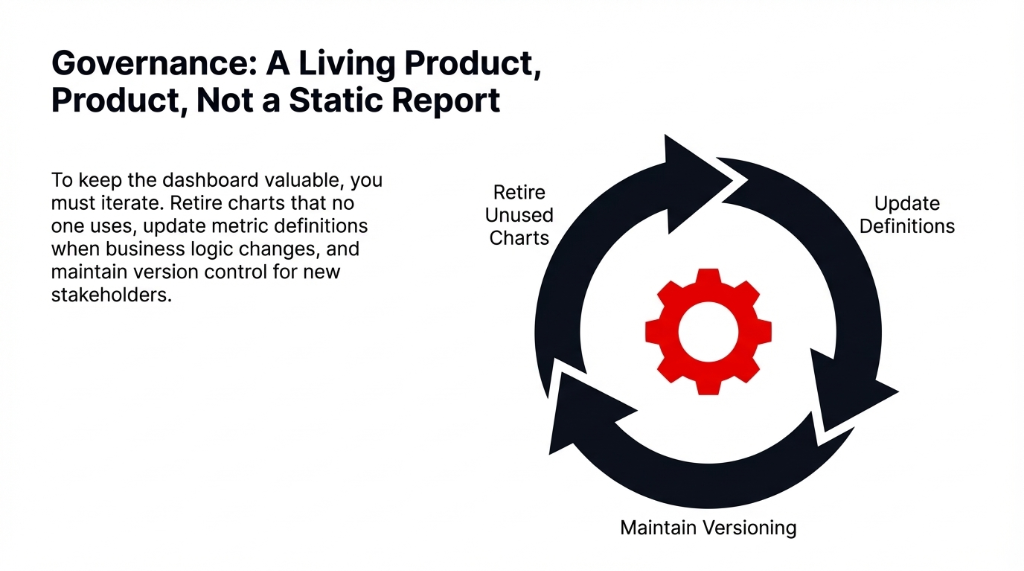
Launching your dashboard is only the beginning. To keep it valuable, you must treat it like a living product inside your agency, not a one-off analysis report.
The Dashboard Governance Checklist
Review metrics in marketing regularly and retire charts that no one uses. Every dead chart makes the dashboard 3% less likely to be opened next week.
Update analytics tools for website tracking when you add new products or funnels. Stale tracking is worse than no tracking.
Keep business analytic tools and data analytics platforms in sync when definitions change (for example, how you count a "lead").
Maintain versioned business report example layouts so new stakeholders can understand history and context. That mindset shift turns reporting from a cost center into a competitive advantage.
FAQs
What is a client results dashboard?
It is a centralized, interactive data dashboard that shows key KPIs and project status for a client in one place, often inside client portals.
Which tools are best to build one?
Common options include Google Looker Studio, Google Analytics dashboard, agency analytics platforms, and other business dashboard software or Microsoft dashboards, depending on your stack.
What metrics should I include?
Start with acquisition, engagement, and revenue KPIs (your main kpi dashboard), then add financial dashboard views and project management dashboard sections as needed.
How do I share dashboards securely with clients?
Use a secure client portal or client portal software to embed dashboards and control access via secure portals and dashboard link sharing.
Can small agencies afford this?
Yes. Many tools offer free client management tiers, free dashboard app options, or low-cost dashboard programs, so you can make a dashboard and build a dashboard without heavy upfront investment.
Count Your Report Exports This Week. That Number Is Your Problem.
Right now, someone on your team is exporting a CSV, pasting it into a Google Sheet, formatting it into a PDF, and emailing it to a client who will glance at it for 45 seconds and then ask a follow-up question that requires another export. We build client results dashboards that replace that entire cycle with one live dashboard link. Bring us your current reporting stack — the messy spreadsheets, the disconnected tools, the "we know this is bad but we have not fixed it" admission — and we will show you what a unified dashboard looks like for your specific clients in under 60 minutes.